
Figure 2.
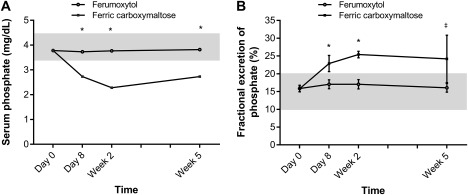
Measures of phosphate. Mean values for (A) serum phosphate and (B) fractional excretion of phosphate by visit. Shading indicates the normal range.15 Error bars show the standard deviation. *P < .0001. † P ≤ .005. ǂ P < .05. To convert serum phosphate to mmol/L, multiply by 0.323