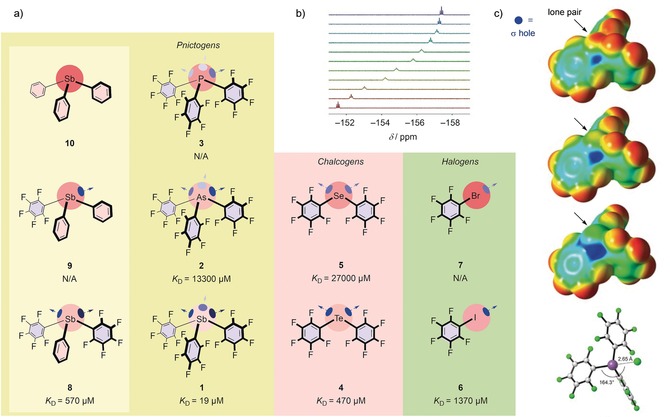
Figure 2.

a) Structures of catalyst candidates 1–10 explored in this study, with dissociation constants of chloride complexes in THF. b) 19F NMR spectra of antimony donor 1 in the presence of increasing concentrations of TBACl (maroon to ultramarine). c) Molecular electrostatic potential surfaces (MEPs) of catalysts 3, 2, and 1 (from top to bottom; M06‐2X/6–311G**/aug‐cc‐pVTZ‐pp; isosurface: 0.001 a.u. (0.627 kcal mol−1); red: −0.01327 a.u. (−8.3 kcal mol−1), blue: +0.04527 a.u. (+28.4 kcal mol−1)), and minimized structure of the chloride complex of 1, with relevant bond lengths and angles. C gray, Cl− green, F green, Sb violet.
