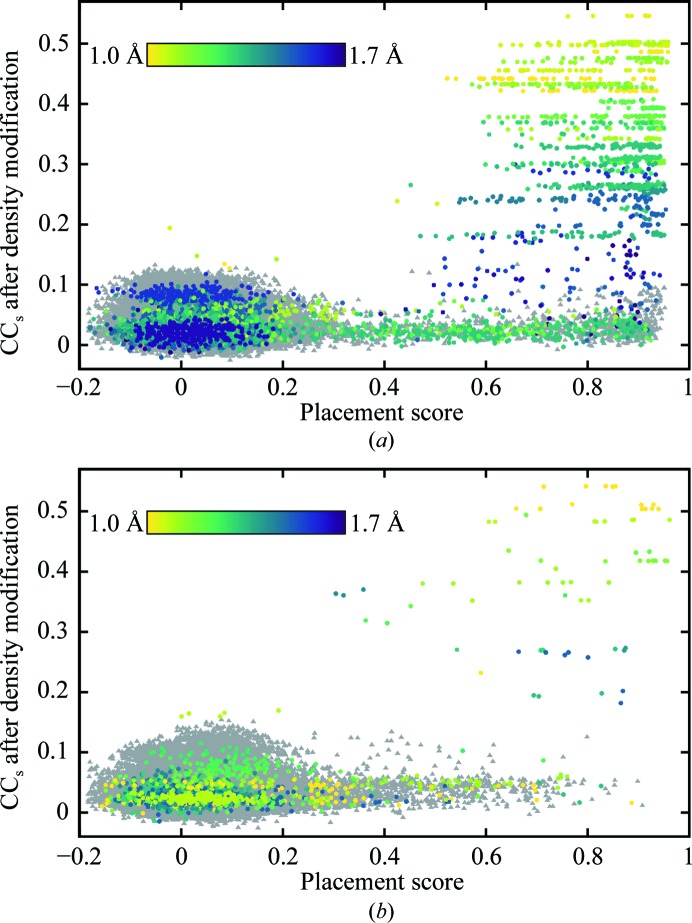
Figure 4.
CCs after ACORN density modification versus ‘placement score’ (§2.4). (a) Mixed α/β test set, (b) all-β test set. In both cases Phaser solutions from successful runs are indicated by circles coloured by resolution and Phaser solutions from unsuccessful runs are shown as grey triangles. For runs in which two ideal α-helices were placed the placement score for the second α-helix is shown, as these runs were only carried out when all runs with a single α-helix were unsuccessful.

