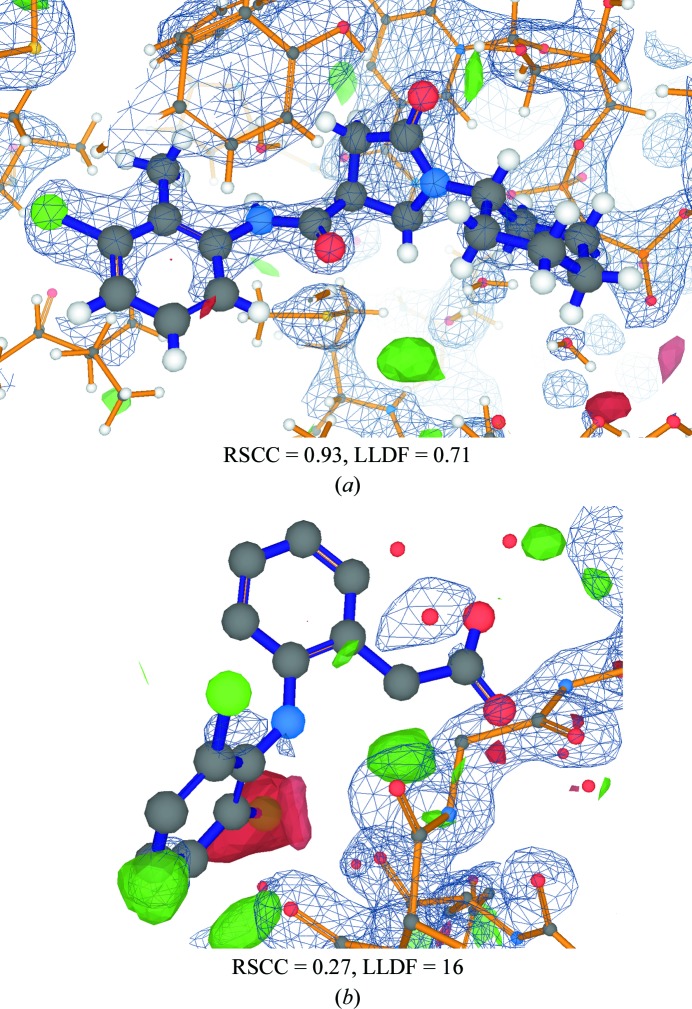
Figure 2.
Visualization of two ligands from the PDB together with electron-density maps. The LiteMol viewer (Sehnal et al., 2017 ▸) on the PDBe website (Mir et al., 2018 ▸) has been used to visualize the ligands with EDS-style (Kleywegt et al., 2004 ▸) electron-density maps. In each case, the 2mF o − DF c map is shown as a blue mesh contoured at 0.39 e Å−3, whereas the mF o − DF c difference map is shown by solid green and red surfaces contoured at +0.25 and −0.25 e Å−3, respectively. (a) Model and electron density for the well placed ligand 468 from PDB entry 4tzt (He et al., 2006 ▸). (b) The ligand DIF in PDB entry 3ib0 (Mir et al., 2009 ▸).

