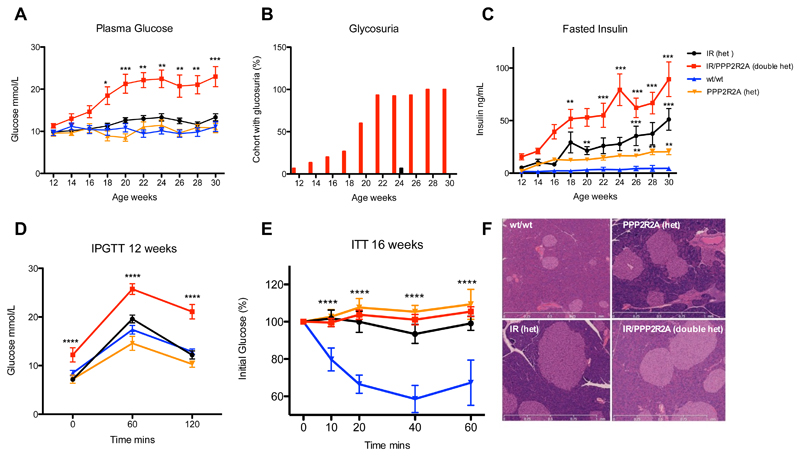
Figure 2. Phenotypic characterization of male IGT10 mice and controls.
A) Fasted plasma glucose levels. B) Presence of glucose in urine. C) Fasted plasma insulin levels. D) IPGTT at 12 weeks of age. E) ITT at 16 weeks of age normalized to starting glucose levels. F) Representative H&E stained pancreas sections. Black circles represent IR heterozygous null mice; Red squares double heterozygous mice, Blue triangles wildtype mice (wt/wt); Orange triangles heterozygous PPP2R2A mice. N=10-15 data expressed as mean ± SD, statistical analysis 2 way ANOVA with a Bonferroni post-test correction for multiple measures * p<0.05, ** p<0.01, *** p<0.001 vs wildtype.

