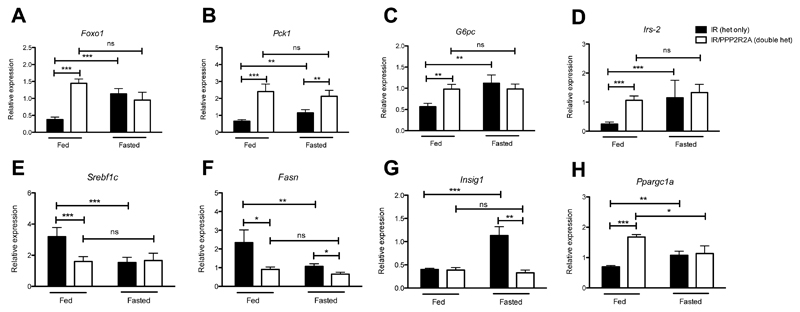
Figure 6. Impaired transcriptional regulation of hepatic glucose production in livers of PPP2R2A het mice.
Hepatic gene expression in free fed vs 18 hour fasted mice. A) Foxo1, B) Pck1, C) G6pc, D) Irs-2, E) Srebflc, F) Fasn, G) Insig1, H) Ppargc1a. Black bars represent IR het only, white bars IR/PPP2R2A double hets. N=8 biological replicates, data is represented as mean ± SD, statistical analysis 2 way ANOVA compared to IR het only fasted * p<0.05, **p<0.01, ***p<0.001.

