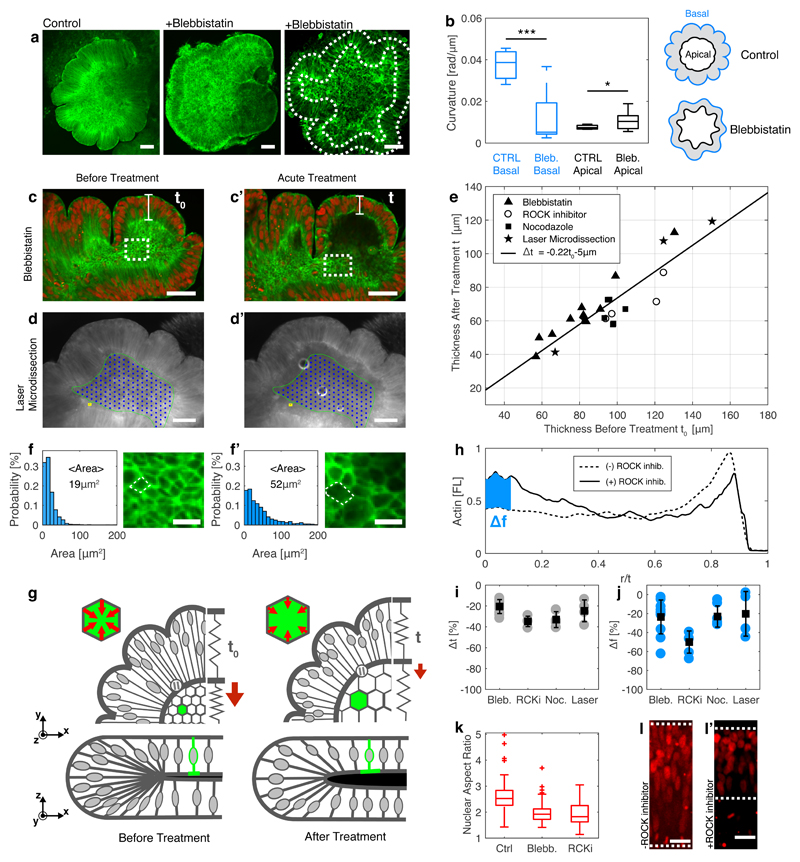
Fig. 4. Cytoskeletal forces maintain organoid core contraction and stiffness.
(a) Images of organoids treated with blebbistatin (+Blebbistatin) during days 6-10 and control. Dashed lines mark inner and outer surfaces. (b) Average curvature < |∂rθ(r)| > of outer (basal, blue) and inner (apical, black) organoid surfaces for control (CTRL) and treated (Bleb.) organoids (N=7-10. (c-d) Images of organoids before and after acute treatment with cytoskeleton disturbing drugs including (c,c’) blebbistatin and (d,d’) laser micro-dissection treatment of the organoid core (marked with green line and blue dots). (e) Organoid thickness before (t0) and after (t) cytoskeleton disturbing treatments including blebbistatin, ROCK inhibitor, nocodazole and laser microdissection. (f,f’) Magnified view of (c,c’) reveals that the inner surface area of cells is increased following drug treatment. (g) Illustration of the organoid during cytoskeleton inhibition, showing the reduction in thickness and increase in inner surface area. (h) Lifeact fluorescence profile along the radial coordinate r/t before (solid line) and after (dashed line) treatment with ROCK inhibitor. Blue area marks the difference in fluorescence intensity at the inner surface (0 < r/t < 0.1). (i) Reduction in inner surface fluorescence and (j) thickness for drug and microdissection treatments. Averages (squares) taken over 4-11 repeats (circles) for each condition. (k) Nuclear aspect ratio in control organoids (Ctrl) and after treatments. Data includes 40-70 nuclei from 3 organoids. (l,l’) H2B-mCherry fluorescence images before and after treatment. Dashed lines indicate inner and outer surfaces. Scale bars are 100μm (a,d), 50μm (c), 20μm (l) and 10μm (f). Error bars represent s.e.m.

