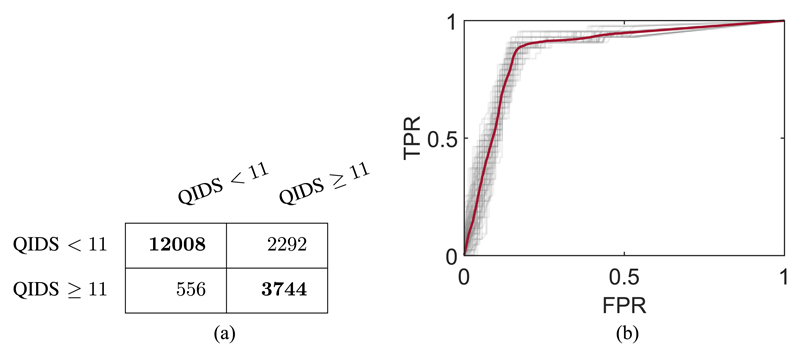
Fig. 6.
Performance metrics of the leave-one-participant-out classifier trained with the five features providing optimal classification accuracy. The confusion matrix (a) shows the classification of test samples of each class. Each row is the true class, and each column is the classification. The ROC graph (b) shows how the classifier performs on positive and negative test samples as the classification threshold is adjusted. The gray traces are the results from the individual models trained in cross-validation and the thicker red trace is the mean value. FPR: false positive rate; TPR: true positive rate.

