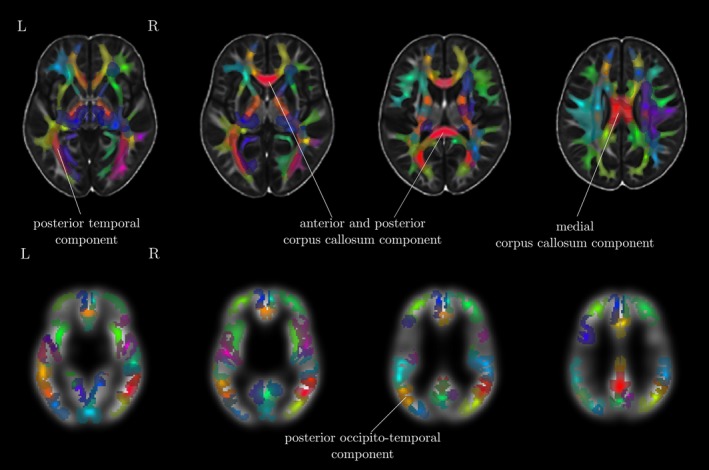
Figure 3.

Overview of the eigenanatomy decomposition for FA images (top) and cortical thickness maps (bottom). The 32 components indicated by eigenatomy decomposition are shown on top of the study‐specific FA and cortical thickness template. Cortical thickness images were down‐sampled and smoothed. Labels indicate the components that were found to show interactions with working memory scores and age
