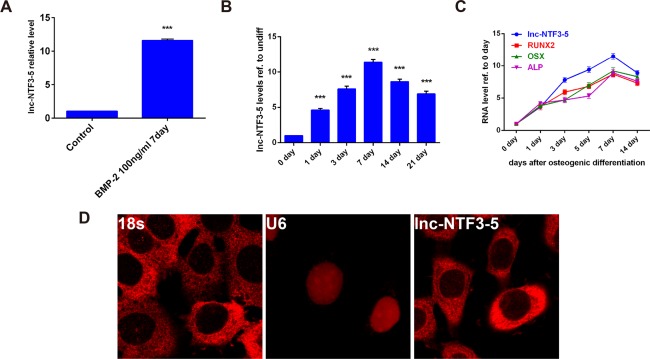
Figure 1.

Lnc‐NTF3–5 expression during osteogenic differentiation of MSMSCs. (A) Relative expression of lnc‐NTF3–5 after 7 d of treatment by BMP‐2. (B) Time‐dependent expression of lnc‐NTF3–5 as determined by qRT‐PCR analysis during osteogenic differentiation of MSMSCs. (C) Correlation analysis between lnc‐NTF3–5 levels and RUNX2, OSX, and ALP expression levels in MSMSCs. (D) RNA‐FISH was conducted to detect lnc‐NTF3–5 localization. 18S and U6 probe were also hybridized to confirm RNA‐FISH specificity. The data are presented as the mean ± SD (*P < .05, **P < .01, ***P < .001)
