FIGURE 1.

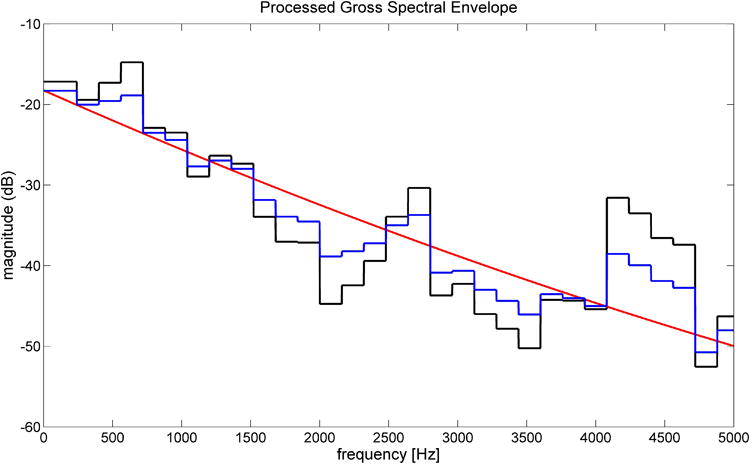
Spectral envelope showing individual harmonics in one pitch period, before processing (black line) and after processing (blue line). The red line shows the mean spectral slope. (Reprinted from Nittrouer et al., 2015)

Spectral envelope showing individual harmonics in one pitch period, before processing (black line) and after processing (blue line). The red line shows the mean spectral slope. (Reprinted from Nittrouer et al., 2015)