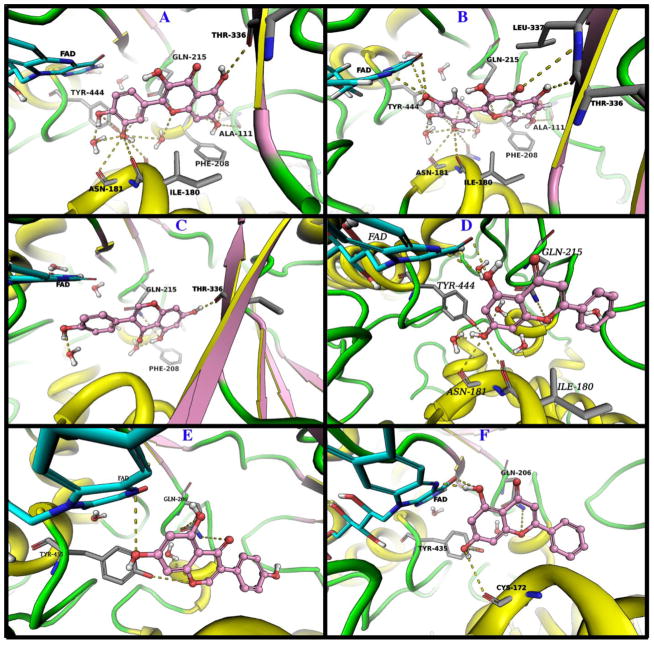
Fig. 7.
The binding modes of quercetin (Panel A), myricetin (Panel B), genistein (Panel C) and chrysin (Panel D) are shown in MAO-A, and the binding modes of genistein (Panel E) and chrysin (Panel F) are displayed in MAO-B. Ligands are shown as pink balls and sticks. The interacting amino acids are shown as grey sticks. Protein is shown as cartoon with yellow helices, pink strands and green loops. All possible hydrogen bonds in the range of 3.5 Å are displayed as yellow dots.

