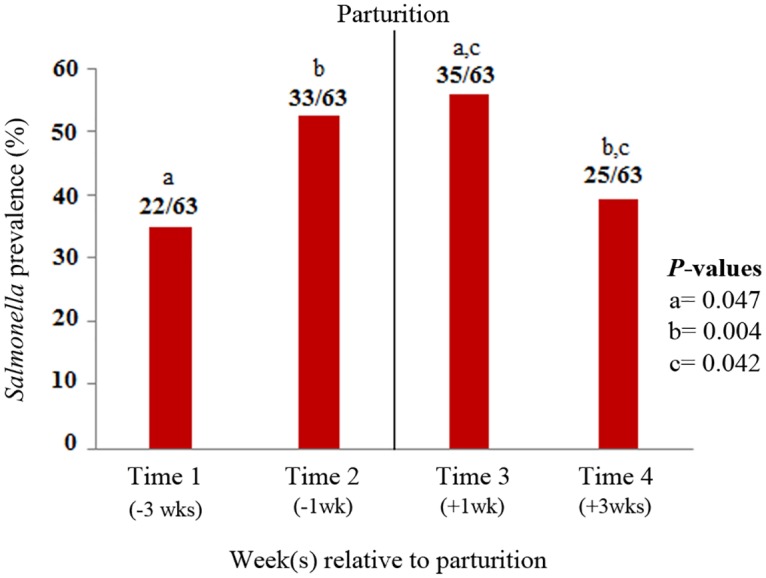
Fig 1. Prevalence of Salmonella during the periparturient period.

Numbers on top of the bars indicate the proportion of Salmonella positive samples over the total sample number at each time point. Letters at the top of the figure represent the time points with a significantly different prevalence (p<0.05) according to the logistic regression analysis.
