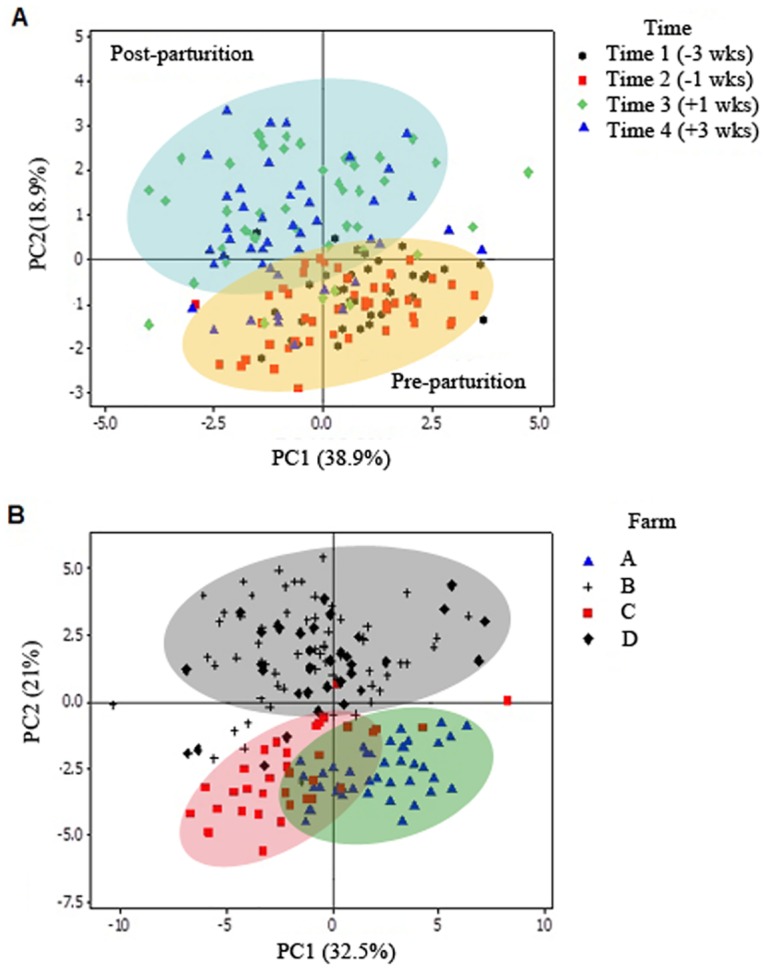
Fig 3. Bi-dimensional principal component plots comparing the total composition of the bacterial fecal microbiome of periparturient dairy cows.

A) Fecal microbiome according to weeks relative to calving (-3, -1, +1, and +3 weeks). Elipses were drawn to highlight the similarity between bacterial communities at pre-parturition (yellow elipse) and post-parturition (light blue elipse). B) Fecal microbiome from farms A, B, C, and D. Large herds with an open heifer replacement system (Farms B and D, gray elipse) had a distinct clustering compared to those with in-farm replacement. Farm A (green elipse) had a significantly less diverse microbiome, indicated by Shannon index.
