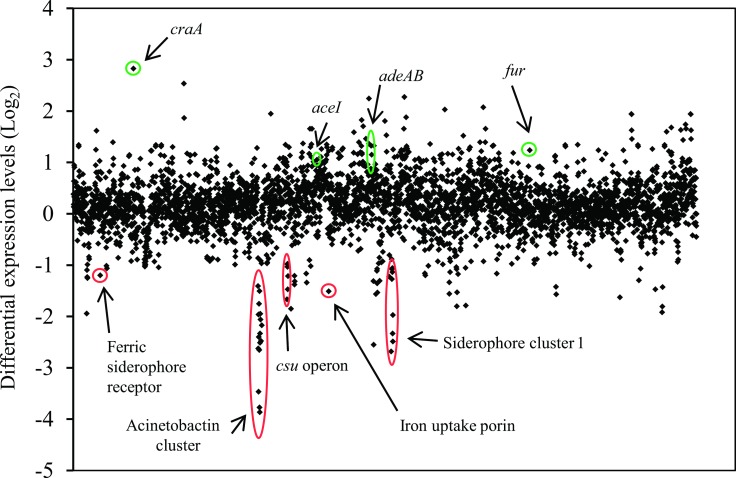
Fig 1. Global transcriptomic response differences of A. baumannii ATCC 17978 after deletion of adeRS.
Each diamond marker represents a predicted gene within the genome ordered according to locus tag along the X-axis and differential expression generated from normalized reads per kilobase mapped of WT against ΔadeRS are displayed on the Y-axis (Log2). Positive and negative Log2-values correlate to up- and down-regulated genes, respectively. Green and red circles highlight genes/gene clusters of interest that have been up- and down-regulated, respectively. See S3 Table for the full list of genes that were differentially expressed ≥ 1 Log2 fold.

