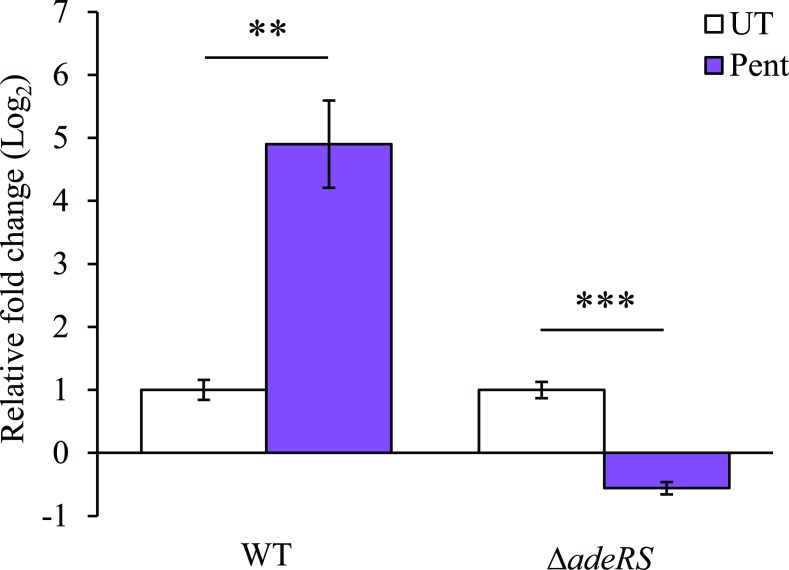
Fig 2. Increased expression of adeA following pentamidine stress is dependent on the presence of AdeRS in ATCC 17978.
Transcriptional levels of adeA (ACX60_09125) from WT and ΔadeRS were determined by qRT-PCR after 30 min shock with 7.8 mg/L of pentamidine (Pent) (0.5 × MIC of ΔadeRS) and corrected to untreated cells (UT) after normalization to 16S. Bars represent the mean fold change (Log2) of three biological replicates undertaken in triplicate, and error bars represent ± SEM. Statistical analyses were performed by Student’s t-test, two-tailed, unpaired; ** = P < 0.01 and *** = P < 0.001.

