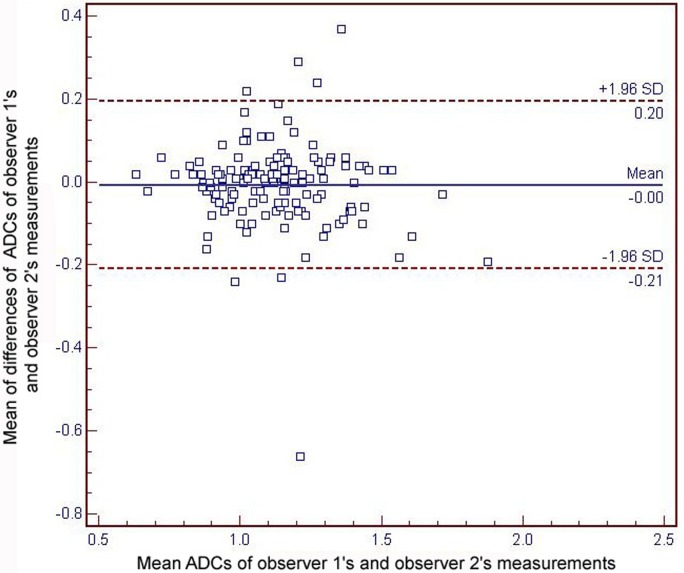
Fig 2. Bland–Altman plots for the reproducibility of apparent diffusion coefficients (ADCs) values between the two observers’ measurements.
The blue line indicates the absolute difference and the dotted red lines indicate the 95% confidence interval of the mean difference. The mean absolute difference in the ADC measurements between the two observers is 0.004 × 10⁻³ mm2/s (limit of agreement, 0.20–0.66).

