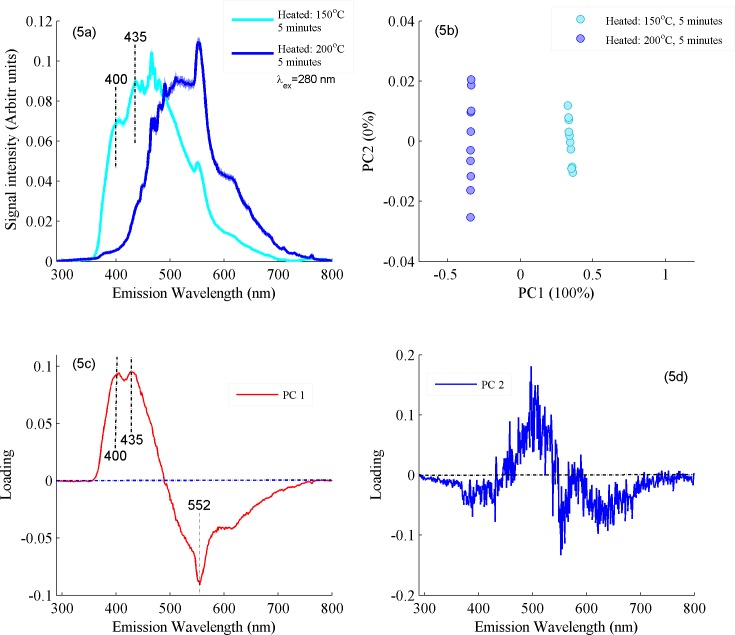
Fig 5.
(a) Fluorescence spectra between ghee samples heated at 150 and 200°C at excitation wavelength of 280 nm. (b) PCA scatter plot is displayed between PC1 and PC2 for the classification of samples heated at 150 and 200°C. (c) Loading vector of first principle component PC1. (d) Loading vector of second principle component PC2.

