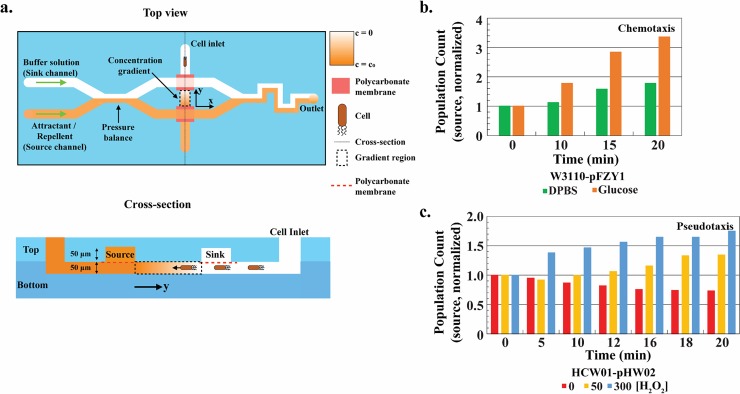
Fig 9. Pseudotaxis using a gradient-generating microfluidic device.
a. Microfluidic device scheme [38]. Cells are introduced to the cell inlet (Top view) which places cells in the bottom channel (Cross-section). The chemical gradient is established by introducing buffer and attractant in flow at sink and source locations, respectively (see Methods). Cells are imaged near source, sink, and in the middle of the gradient (Top view). b-c. Chemotaxis vs. pesudotaxis population source image analysis. Images were taken at the indicated time intervals with t = 0 designated to be the introduction of glucose or H2O2 solution into the source channel. All population counts normalized to time 0 population counts at the respective positions. WT-pFZY1 with 100 μM glucose as the source yielded a chemotaxic response (towards glucose source). HCW01-pHW02 with hydrogen peroxide demonstrated pseudotaxis.

