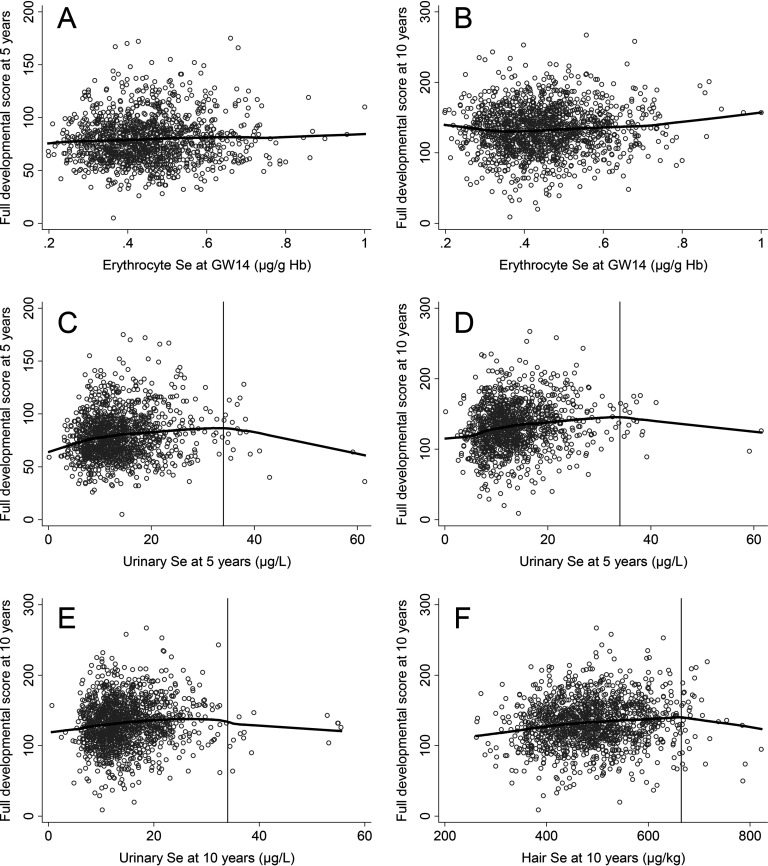
Figure 2.
Scatter plots with smoothed lowess lines for prenatal and childhood selenium (Se) and full developmental score (raw score) at 5 and 10 y. (A) Erythrocyte Se at gestational week (GW) 14 [ hemoglobin (Hb)] and full developmental score at 5 y, (B) erythrocyte Se at GW14 ( Hb) and full developmental score at 10 y, (C) urinary Se at 5 y () and full developmental score at 5 y, (D) urinary Se at 5 y ( ) and full developmental score at 10 y, (E) urinary Se at 10 y () and full developmental score at 10 y, (F) hair Se at 10 y () and full developmental score at 10 y. The vertical lines in the lower panels represent the turning point used for the knot in the linear spline regression analyses ( for urinary Se at 5 and 10 y and for hair Se at 10 y).

