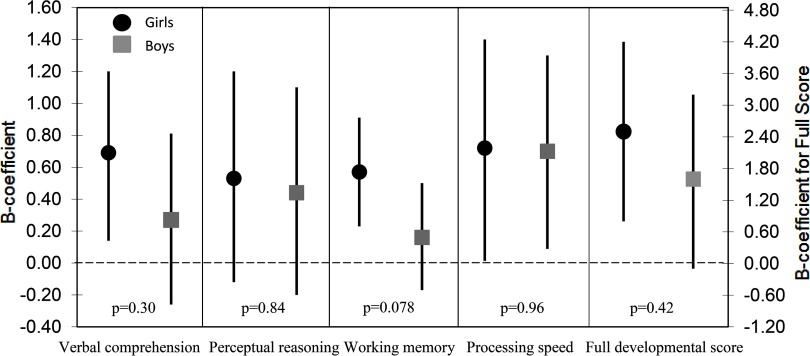
Figure 3.
Estimates (B-coefficient) and 95% confidence interval (CI) (straight line) for associations between all outcomes at 10 y and erythrocyte selenium (Se) [per hemoglobin (Hb)] at gestational week (GW) 14, stratified by gender ( girls and 737 boys). p-Value for difference between estimates (Wald test). Adjustments: gestational age at birth, age at testing, mothers’ cognitive function assessed at 5 y, number of children in the family, height-for-age z-score (HAZ), modified version of Home Observation for Measurement of the Environment score (HOME), testers, school type and years of schooling, family socioeconomic status (SES), and paternal education (all assessed at 10 y).

