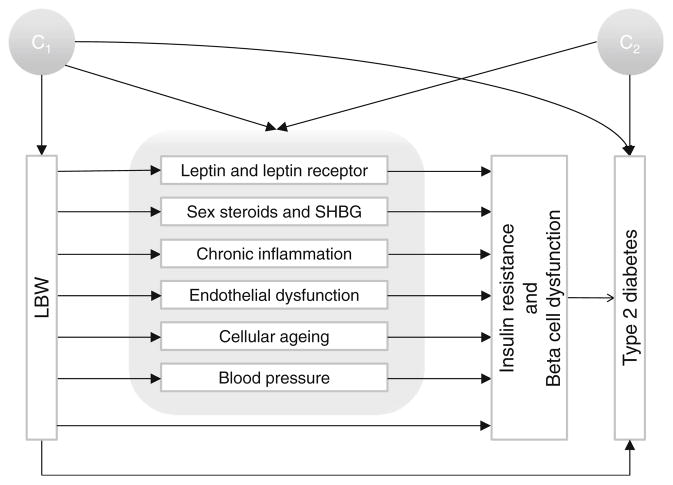
Fig. 1.
Causal diagram hypothesised for mediation and confounding, characterising the relationship between LBW and type 2 diabetes risk later in life. C1 represents the potential confounders that occurred before birth (race/ethnicity and family history of diabetes) and C2 indicates the potential confounders that occurred after birth (age, smoking, alcohol consumption, physical exercise, total fibre intake, dietary glycaemic load and BMI)

