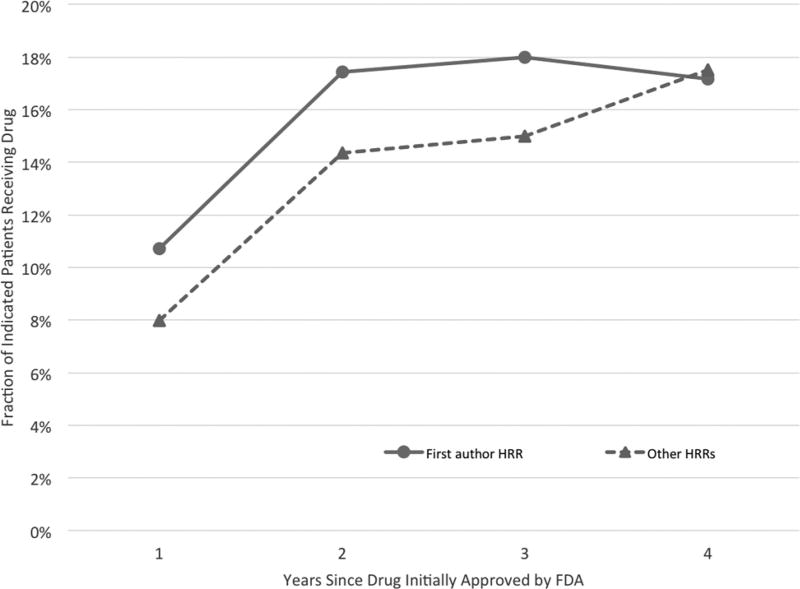
Figure 2. New Cancer Drug Utilization Rates, by Years since FDA Approval.
The figure plots raw usage for new drugs in the first author’s HRR versus all other HRRs. The “First author HRR” and “Other HRRs” rates are generated by averaging over the drug-specific first author HRR and non–first author HRR rates calculated separately for each drug in each year. To make rates over time comparable, we restrict to the 67% of drugs in our sample for which four years of usage rates are available.

