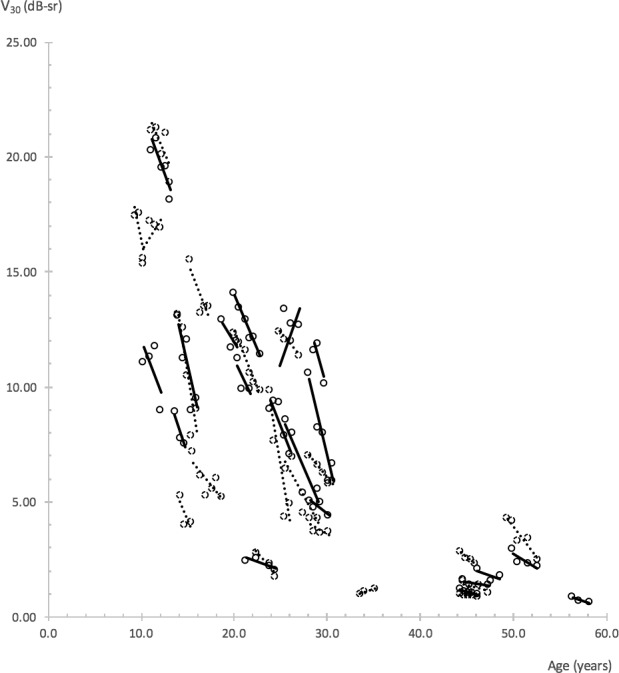
Figure 2.

Linear trend lines illustrating V30 progression rates. Trend lines and data points of right eyes are represented by solid slope lines and solid circles, left eyes by dotted slope lines and dotted circles. Trend lines with R2 ≥ 0.4 are shown. Perimetry tests that met reliability criteria were used. A minimum of three tests with follow-up duration ≥1 year were required of each eye.
