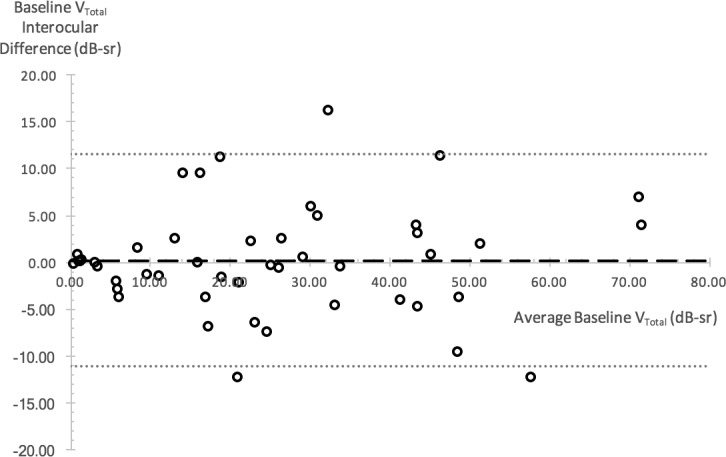
Figure 3.

Bland-Altman plot illustrating VTotal interocular differences at baseline. Interocular difference is plotted against the average interocular value for each subject as represented by a circular data point. Dashed line shows mean of interocular differences; dotted lines represent upper and lower 95% limits of agreement.
