
Fig. 1. YSR states of individual magnetic Fe atoms and their interactions on Re(0001).
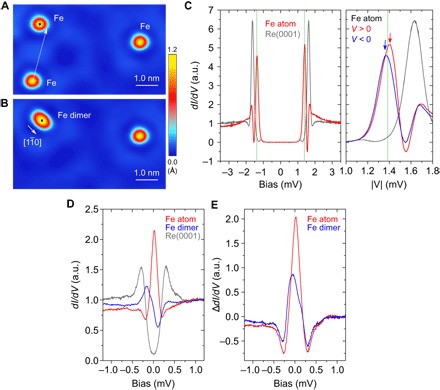
(A and B) STM topographic images of isolated Fe atoms (A) and an Fe dimer (B) on Re(0001). Tunneling current, IT = 5.0 nA; sample bias voltage, VS = 3.0 mV; scan area, 7.0 × 4.0 nm2. The Fe dimer in (B) was created by placing an Fe atom next to another [white dotted arrow in (A)] at a distance of aRe = 0.274 nm. (C) Left: dI/dV spectra on a single Fe atom (red) and on the bare Re substrate (gray) measured with a superconducting Nb tip (IT = 1.0 nA, VS = 3.0 mV). Right: Same spectra plotted as a function of |V|. The green dotted line indicates the energy position of the superconducting gap edge of the Nb tip (Materials and Methods). A pair of YSR resonances are indicated by red and blue arrows at |ΔNb ± EB|, with ΔNb = 1.38 meV and EB = 0.020 meV, providing a signature for the localized magnetic moment of the Fe atom. (D) dI/dV spectra obtained at the positions marked by black dots in (A) and (B) for a single Fe atom (red), an Fe dimer (blue), and the bare Re(0001) (gray) measured with a nonsuperconducting tip (IT=5.0 nA, VS=1.5 mV). (E) Difference spectra for an Fe atom and a dimer after subtracting the spectrum obtained on the bare Re(0001) surface. Except for (C), a PtIr tip was used for taking topography images and spectra. All STM images and tunneling spectra were measured at T = 350 mK. a.u., arbitrary units.