
Fig. 1. Experimental technique and interband-to-intraband heating transition.
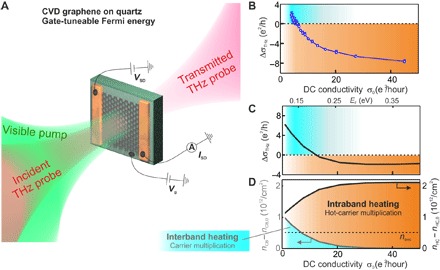
(A) Illustration of the optical pump–THz probe measurement technique and the gate-tunable graphene device design, as explained in the main text and Methods. By applying a gate voltage Vg to the polymer electrolyte, we change the Fermi energy of graphene and thereby its DC conductivity σ0. By applying a source-drain voltage VSD between the two contacts and measuring the current ISD, we extract σ0 (after correcting for contact resistance). (B) The measured THz photoconductivity ΔσTHz as a function of simultaneously measured DC conductivity σ0, following a pump pulse with a wavelength of 800 nm that creates a photoexcited carrier density nexc = 0.5 × 10¹²/cm2. (C) Theoretical calculation (see Methods) of the THz photoconductivity versus DC conductivity (bottom horizontal axis) or Fermi energy (top horizontal axis) for the same parameters as in the experiment, at time t = 300 fs after photoexcitation. The theoretical results (which are free of adjustable parameters) reproduce the magnitude of the signal within a factor ≲ 2 and the positive-to-negative transition. (D) The calculated carrier density in the conduction band (left vertical axis) and hot-carrier density (right vertical axis) with respect to equilibrium, for the same parameters as in the experiment. The dashed horizontal line indicates nexc, which is the same for all equilibrium DC conductivities. Interband heating occurs when nCB − nCB,0 > 0, whereas intraband heating occurs when nHC − nHC,0 >0.