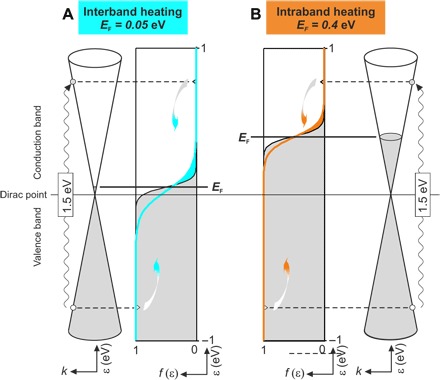
Fig. 2. Interband versus intraband heating.

The panels show the calculated electron distribution f(ε) as a function of energy ε, at time t = 0 before photoexcitation (black lines and gray areas) and at a time t = 300 fs (cyan and orange lines and areas). The state occupation in the Dirac cones is also depicted alongside the electron distribution. The wavy lines represent the photoexcitation of electrons (holes) in conduction (valence) band at energy Eph/2 (− Eph/2). The pump photons have energy Eph = 1.5 eV. (A) At the equilibrium Fermi energy EF ≃ 0.05 eV, the broadening of the electron distribution involves electronic transitions from valence to conduction band, represented by cyan arrows, that is, interband heating. (B) At EF ≃ 0.4 eV, the broadening is mostly due to electronic transitions from below to above the chemical potential, represented by orange arrows, that is, intraband heating.
