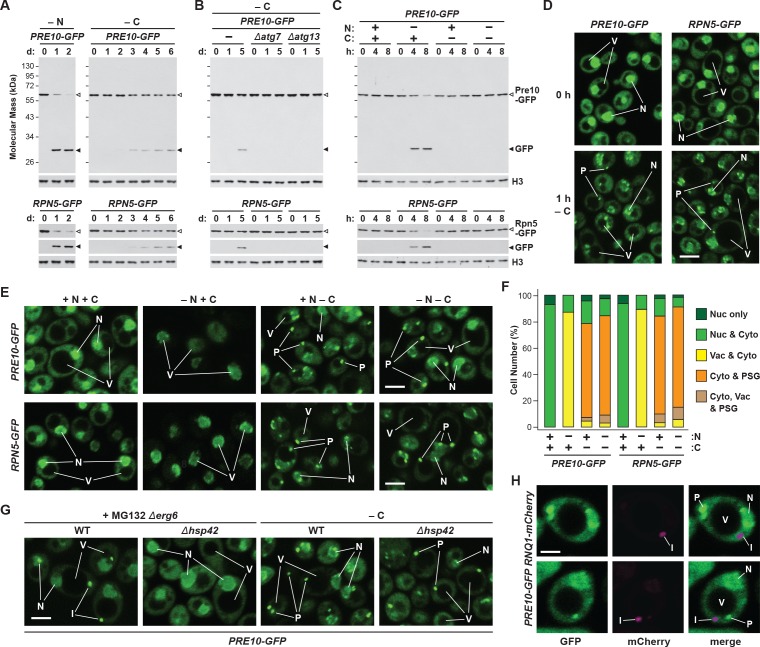
Figure 1. Proteasomes are rapidly degraded upon nitrogen but not carbon starvation.
(A, B and C) Measurement of proteaphagy upon nitrogen and/or carbon starvation by monitoring the release of free GFP from the CP and RP proteasome subunit reporters Pre10-GFP and Rpn5-GFP, respectively. Cells expressing PRE10-GFP or RPN5-GFP, and also containing the Δatg7 or Δatg13 mutations (panel B only), were switched from nutrient-rich medium (+N + C) to medium lacking either nitrogen (–N), carbon (–C), or both (–N –C). Total protein extracts from cells collected at the indicated times were assayed for GFP release by immunoblot analysis with anti-GFP antibodies. Open and closed arrowheads locate the GFP fusions and free GFP, respectively. The full gels are shown for the Pre10-GFP reporter, whereas only the regions of the gels containing the GFP fusion and free GFP are shown for the Rpn5-GFP reporter. Immunodetection of histone H3 was used to confirm near equal protein loading. (D) Proteasomes rapidly coalesce into PSG-type puncta soon after carbon starvation. PRE10-GFP or RPN5-GFP cells were examined by confocal fluorescence microscopy immediately before and 1 hr after switching from +N +C medium to –C medium. Scale bar, 2 µm. (E) Proteasomes are deposited into vacuoles upon nitrogen starvation, but form cytoplasmic PSG-type puncta in response to carbon starvation. PRE10-GFP or RPN5-GFP cells were grown on +N +C medium and then switched to +N +C, –N, –C, or –N –C media for 24 hr before imaging by confocal fluorescence microscopy. Scale bar, 2 µm. (F) Quantification of the cellular distribution of proteasomes when grown in +N +C, –N, –C, or –N –C media. Cells were treated and imaged as in panel (E). Each bar represents analysis of at least 200 cells. (G) Aggregation of proteasomes into IPODs, but not PSGs, requires the Hsp42 chaperone. PRE10-GFP cells with or without the Δerg6 and/or Δhsp42 mutations were switched from +N +C medium to either –C medium or +N +C medium containing 80 µM MG132 (+MG132) for 24 hr before imaging as in panel (E). Scale bar, 2 µm. (H) PSGs formed upon carbon starvation are distinct from IPOD puncta. PRE10-GFP cells also expressing the IPOD marker RNQ1-mCherry were switched from +N +C medium to –C medium for 24 hr before imaging as in panel E. Shown are the GFP, mCherry and merged fluorescence images. Scale bar, 1 µm. In panels D, E, G, and H: N, nucleus; V, vacuole; P, PSG; I, IPOD.


