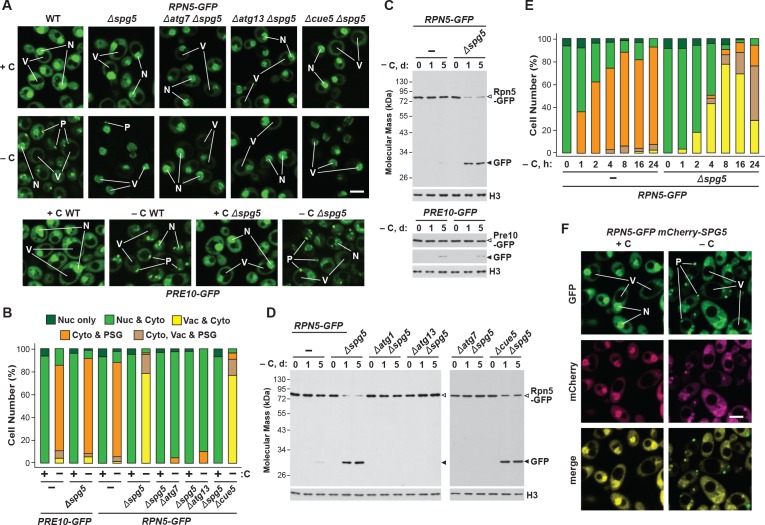
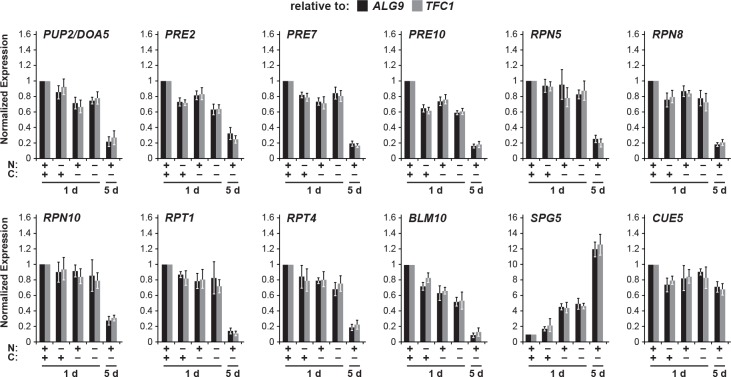
Figure 5. Spg5 encourages formation of RP-containing PSGs and suppresses autophagy of the RP in response to carbon starvation.
(A) Elimination of Spg5 suppresses formation of RP-containing PSGs and permits autophagic transport of the RP to the vacuole. PRE10-GFP or RPN5-GFP cells with or without the Δspg5 mutation, either alone or in combination with the Δatg7, Δatg13 or Δcue5 mutations, were grown on nutrient-rich (+N +C) medium and then switched to –C medium for 24 hr before imaging by confocal fluorescence microscopy. Scale bar, 2 µm. (B) Quantification of the cellular distribution of 26S proteasomes in response to carbon starvation in the absence of Spg5 and components of the autophagy machinery. Cells were grown, treated and imaged as in panel (A). Each bar represents analysis of at least 200 cells. (C) Deletion of Spg5 accelerates proteaphagy of the RP, but not the CP, in response to carbon starvation. PRE10-GFP or RPN5-GFP cells with or without the Δspg5 mutation were switched from +N +C medium to –C medium for the indicated times. Total protein extracts were assayed for GFP release by immunoblot analysis with anti-GFP antibodies, as shown in Figure 1A. Open and closed arrowheads locate the GFP fusion and free GFP, respectively. Immunodetection of histone H3 was used to confirm near equal protein loading. (D) Autophagic turnover of the RP in response to carbon starvation in the absence of Spg5 requires the core autophagy machinery, but not Cue5. RPN5-GFP cells with or without the Δspg5 mutation, either alone or in combination with the Δatg1, Δatg7, Δatg13 or Δcue5 mutations, were grown on +N +C medium and then switched to –C medium for the indicated times. Total protein extracts were assayed for GFP release by immunoblot analysis with anti-GFP antibodies as shown in panel (C). (E) Deletion of Spg5 delays, but does not completely block, formation of RP-containing PSGs in response to carbon starvation. RPN5-GFP cells with or without the Δspg5 mutation were switched from +N + C medium to –C medium for the indicated times before imaging by confocal fluorescence microscopy as in panel (A). The cellular distribution of GFP was quantified as in panel B; the color code for the bars is also included in this panel. Each bar represents analysis of at least 200 cells. (F) Spg5 does not routinely co-localize with Rpn5 into PSGs upon carbon starvation. RPN5-GFP cells also expressing mCherry-SPG5 were switched from +N +C medium to –C medium for 24 hr before imaging by confocal fluorescence microscopy. Shown are the GFP, mCherry, and merged fluorescence images. Scale bar, 2 µm. In panels A and F: N, nucleus; V, vacuole; P, PSG.


