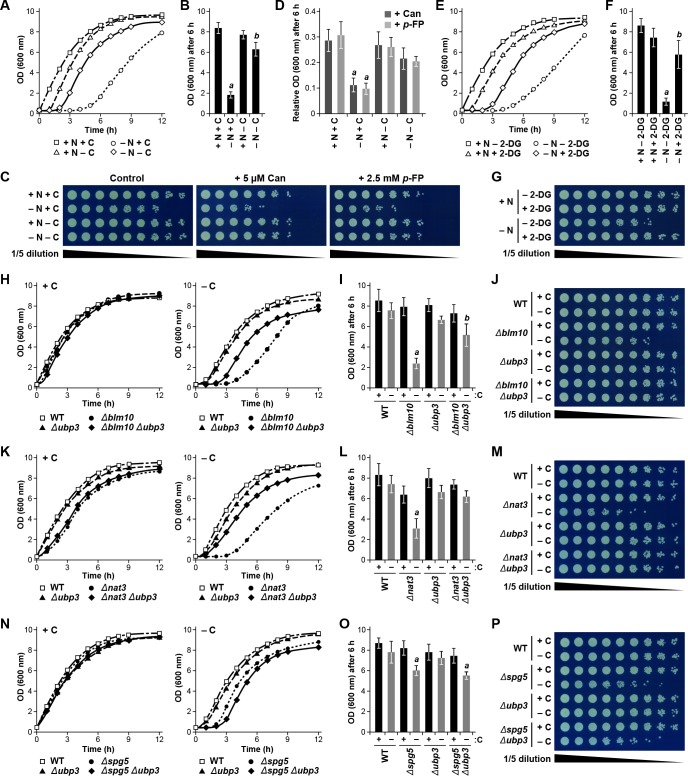
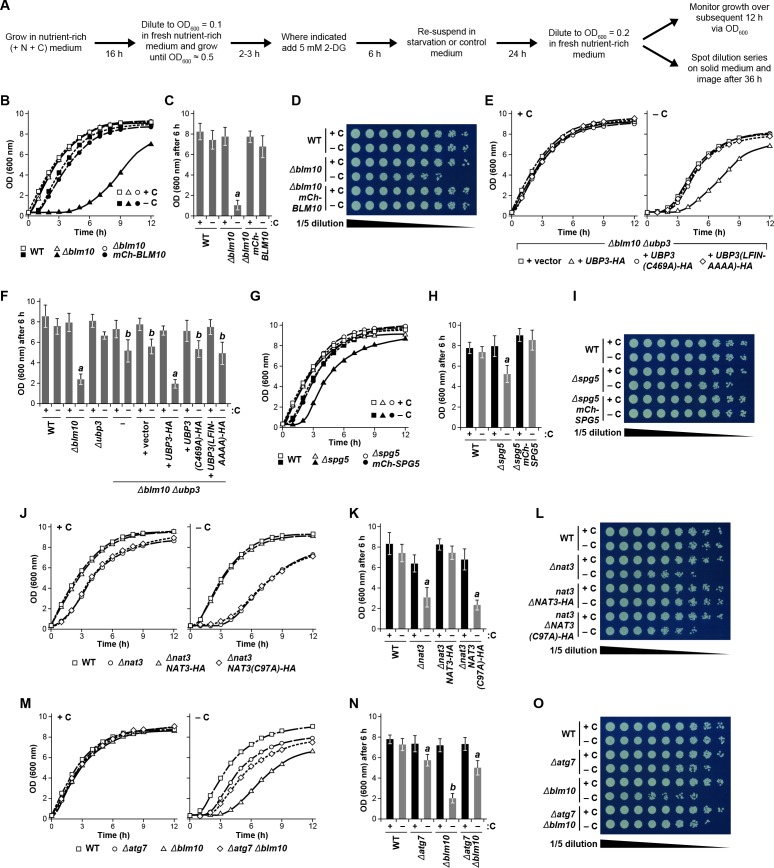
Figure 8. Protecting yeast proteasomes in PSGs upon starvation increases cell fitness.
(A) Delayed resumption of yeast cell growth following nitrogen starvation is reversed by simultaneous carbon starvation. Cells were grown in nutrient-rich (N + C) medium and then switched to either medium lacking nitrogen (–N), carbon (–C), or both (–N –C) for 24 hr. Near equal numbers of cells were then re-suspended in +N +C medium, and monitored for the resumption of cell growth by measuring culture density at OD600 over the next 12 hr. (B) Quantification of cell growth following nutrient starvation. Cells were grown as in panel (A), and cell growth was quantified by measuring culture density at OD600 6 hr after re-suspension in +N +C medium. (C) Reduced cell growth and increased susceptibility to amino acid analogs following nitrogen starvation is reversed by simultaneous carbon starvation. Cells were treated as in panel (A), and near equal numbers of cells were re-suspended in +N +C medium. Five-fold serial dilutions were then spotted onto synthetic complete medium with or without 5 μM canavanine (Can) or 25 mM p-fluorophenylalanine (p–FP) and incubated at 30°C for 36 hr. (D) Effects of amino acid anaolgs on cell growth following nutrient starvation. Cells were grown and treated as in panel (A), re-suspended in +N +C medium, and the resumption of cell growth in the presence or absence of 5 μM Can or 25 mM p-FP was monitored by measuring culture density at OD600 after 6 hr. The OD600 values in the presence of each analog were then normalized to those in the absence of the analogs. (E) Delayed resumption of cell growth following nitrogen starvation is reversed by pre-treatment with 2-DG. Cells were grown in +N +C medium with or without 5 mM 2-DG and 2 mM NaN3, and then switched to medium lacking nitrogen for 24 hr. Near equal numbers of cells were then re-suspended in +N +C medium, and the resumption of cell growth was monitored as in panel (A). (F) Quantification of cell growth during nitrogen starvation after a pre-treatment with 2-DG. Cells were grown and treated as in panel (E), and cell growth was quantified as in panel (B). (G) Reduced cell growth following nitrogen starvation is reversed by pre-treatment with 2-DG. Cells were treated as in panel (E), and near equal numbers of cells were re-suspended in +N +C medium. Five-fold serial dilutions were then spotted onto synthetic complete medium and incubated at 30°C for 36 hr. (H) Cells lacking BLM10 delay resumption of growth following carbon starvation, which is reversed by simultaneous deletion of UBP3. Cells were grown in +N +C medium and then switched to –C medium for 24 hr. Near equal numbers of cells were then re-suspended in +N +C medium, and the resumption of cell growth was monitored as in panel (A). Left panel, non-starved cells; right panel, carbon-starved cells. (I) Quantification of cell growth for strains lacking BLM10 and/or UBP3 following carbon starvation. Cells were grown and treated as in panel (H), and cell growth was quantified as in panel (B). (J) Reduced growth of Δblm10 cells following carbon starvation is reversed by deletion of UBP3. Cells were treated as in panel (H), and near equal numbers of cells were re-suspended, spotted onto synthetic complete medium and incubated as in panel (G). (K) Cells lacking NAT3 delay resumption of growth following carbon starvation, which is reversed by simultaneous deletion of UBP3. Cells were grown and treated as in panel (H), and the resumption of cell growth was monitored as in panel (A). Left panel, non-starved cells; right panel, carbon-starved cells. (L) Quantification of cell growth for strains lacking NAT3 and/or UBP3 following carbon starvation. Cells were grown and treated as in panel (H), and cell growth was quantified as in panel (B). (M) Reduced growth of Δnat3 cells following carbon starvation is reversed by deletion of UBP3. Cells were treated as in panel (H), and near equal numbers of cells were re-suspended, spotted onto synthetic complete medium and incubated as in panel (G). (N) Cells lacking SPG5 have slightly delayed resumption of growth following carbon starvation, but this resumption is not reversed by simultaneous deletion of UBP3. Cells were grown and treated as I panel (H), and the resumption of cell growth was monitored as in panel (A). Left panel, non-starved cells; right panel, carbon-starved cells. (O) Quantification of cell growth for strains lacking SPG5 and/or UBP3 following carbon starvation. Cells were grown and treated as in panel (H), and cell growth was quantified as in panel (B). (P) Reduced growth of Δspg5 cells following carbon starvation is not reversed by deletion of UBP3. Cells were treated as in panel (H), and near equal numbers of cells were re-suspended, spotted onto synthetic complete medium and incubated as in panel (G). Bars in panels B, D, F, I, L and O represent the mean (±SD) of three independent biological replicates. Letters represent data points that are statistically significantly different from the control (p<0.05).


