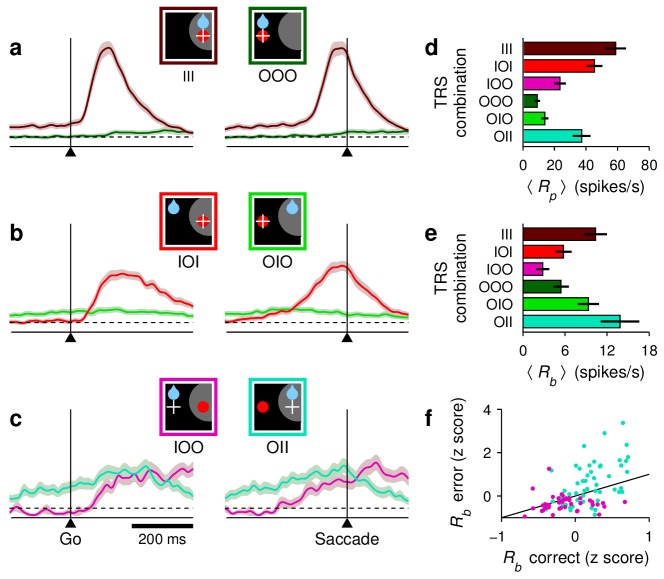
Figure 3. Baseline activity predicts response gain, threshold, and outcome.
(a–c) Normalized firing rate as a function of time for a population of 62 neurons (, , and ) for which both correct and incorrect responses were collected. Icons indicate target (red circle), rewarded location (blue drop), and saccade (white cross) relative to the RF (gray area) in each case. Paired reddish and greenish traces correspond to activity with the target inside or outside the RF, respectively, in the same behavioral condition. For congruent trials (a) only correct responses are shown. For incongruent trials both correct (b) and incorrect (c) responses are shown. The reference line (dotted) is identical across panels. (d) (e) Mean peak activity (d) and mean baseline activity (e) for each target-reward-saccade (TRS) combination, from the same 62 neurons in (a–c). Error bars indicate SE across cells. (f) Baseline activity (z-scored) for incorrect (y axis) versus correct outcomes (x axis) under identical target and reward conditions. Each point is one neuron. Magenta dots indicate IOO versus IOI trials (target in/reward out); cyan dots indicate OII versus OIO trials (target out/reward in).


