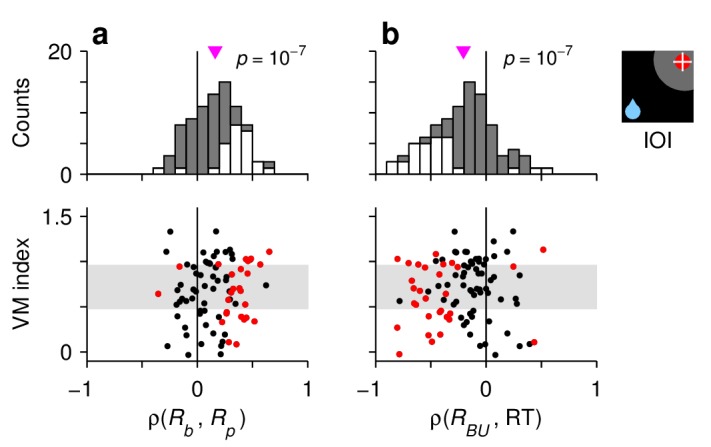
Figure 4. Characteristic manifestations of the rise-to-threshold process in single FEF neurons.

Each panel shows Spearman correlation coefficients calculated for 90 , , and neurons. (a) Correlations between baseline activity and peak response. (b) Correlations between build up-rate and RTals. In each panel, the scatterplot (bottom) shows the same correlation coefficients as the histogram (top) but together with the visuomotor indices of the neurons. Gray shades in the scatterplots demarcate the borders defining the , , and cell categories. White bars in histograms and red points in scatterplots indicate significant correlations (). Pink triangles mark mean values, with significance from a signed-rank test indicated.
