. 2018 Apr 13;7:e33456. doi: 10.7554/eLife.33456

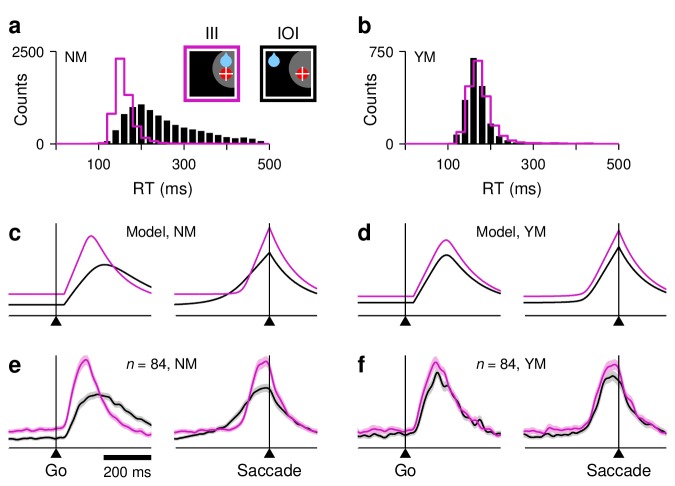
Figure 6. Disentangling the coupling between baseline activity, build-up rate, and threshold.

(a) Original RT distributions for III (magenta) and IOI (black) trials from all FEF recording sessions (non-matched condition, NM). (b) RT distributions after RT matching (yes-matched condition, YM). (c), Firing rate as a function of time for the target-driven activity, RT, in simulated III (magenta) and IOI (black) trials; same as red traces in Figure 5d,e. RTs are not matched. (d) As (c), but with matched RTs. (e) Normalized firing rate as a function of time for a population of 84 V, VM, and M neurons. RTs are not matched. (f) As (e) but with matched RTs.

Figure 6.

Figure 6—figure supplement 1. Comparisons between congruent and incongruent conditions, with and without RT equalization, for individual cell types.

Figure 6—figure supplement 1.

Each panel shows normalized firing rate as a function of time in III (magenta) versus IOI (black) trials. Plots on the left include all recorded trials in each condition (non-matched), whereas plots on the right only include trials with matched RTs (yes-matched). The format is the same as in Figure 6e,f. (a) Responses of 25 V neurons. (b) Responses of 37 VM neurons. (c) Responses of 22 M neurons. The effect of RT matching is qualitatively similar for the three cell types.