. 2018 Apr 13;7:e33456. doi: 10.7554/eLife.33456

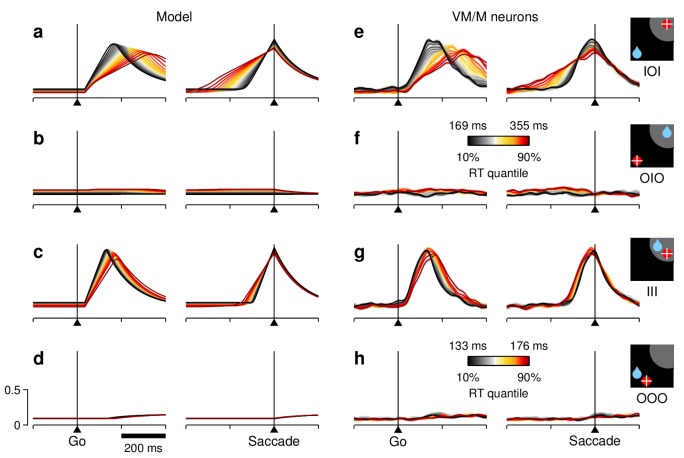
Figure 7. RT sensitivity of the average population activity.

(a–d) Firing rate as a function of time for the simulated motor plans RT (a, c) and RD (b, d) during incongruent (a, b) and congruent (c, d) trials. The corresponding experimental conditions are indicated by the icons (far right). Curves are based on the same simulations as in Figure 5d–f. Each colored trace includes 20% of the simulated trials around a particular RT quantile. (e–h) Normalized firing rate as a function of time for a population of 84 FEF neurons (V, VM, and M). Activity is for correct saccades in the four experimental conditions indicated. Each colored trace includes 20% of the trials recorded from each participating cell around a particular RT quantile. Lighter shades behind lines indicate ± 1 SE across cells. Color bars apply to both simulated and recorded data in incongruent (color bar in [f]) or congruent conditions (color bar in [h]). The scale bars in (d) apply to all panels.

Figure 7.

Figure 7—figure supplement 1. Correlation between RT and activity during correct saccades away from the RF.

Figure 7—figure supplement 1.

For each row, the corresponding target-reward-saccade configuration is depicted by the icon on the far right. (a) Normalized neural responses. Each colored trace corresponds to population firing rate as a function of time for a subset of trials around a particular RT quantile. Traces are the same as in Figure 7f,h, but with a shorter scale on the y axes, as marked on the bottom panel. The dashed reference line is identical across panels. (b) Distributions of Spearman correlation coefficients between RT and mean activity, ρ(Rm,RT), where Rm is the mean response between the go signal and saccade onset. The data in each histogram are from the same 84 cells used in Figure 7. White bars correspond to significant correlations (p<0.05). Pink triangles mark mean values, with significance from signed-rank tests shown next to them.
Figure 7—figure supplement 2. RT sensitivity of the VM/M population activity.

Figure 7—figure supplement 2.

The format is exactly the same as in Figure 7, except that the results are based only on the activity of the cells classified as VM and M; that is, all of the V neurons (n=26, visuomotor index < 0.46) were excluded. The resulting population averages (e–h) showed only slight differences with respect to the averages obtained with the larger neuronal sample. For the simulations shown (a–d), the model parameters were adjusted so that the model matched those slight differences in activity, while still replicating the corresponding RT distributions.
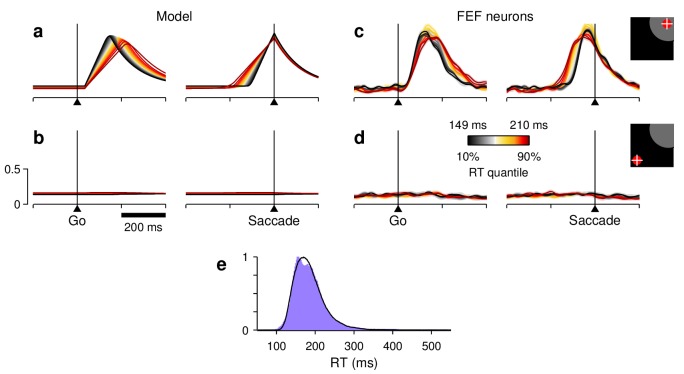
Figure 7—figure supplement 3. Responses in the ADR task, in which all correct trials were equally rewarded.

Figure 7—figure supplement 3.

(a,b) Firing rate as a function of time for the motor plans RT (a) and RD (b) during simulated ADR trials. Colors correspond to RT quantiles, as in previous figures. (c, d) Normalized firing rate as a function of time for a population of 38 FEF neurons (V, VM, and M) recorded in the ADR task. Activity is for correct saccades into (c) or away from (d) the cells’ RFs, as indicated. (e) RT distributions obtained from the ADR recording sessions (purple shade) and from the simulations (black trace). Model results were generated with the same parameters used to simulate the IOI and III trials in the 1DR task, with three exceptions: the two mean baseline values were equal and less variable (BT=BD=0.2 and σ=0.14 in Equation 5), and the build-up rate of the stimulus-driven response was slightly lowered (by setting the first term in Equation 5 equal to 5.95 instead of 6.16). Otherwise, the model simulations proceeded exactly as described for the 1DR task.