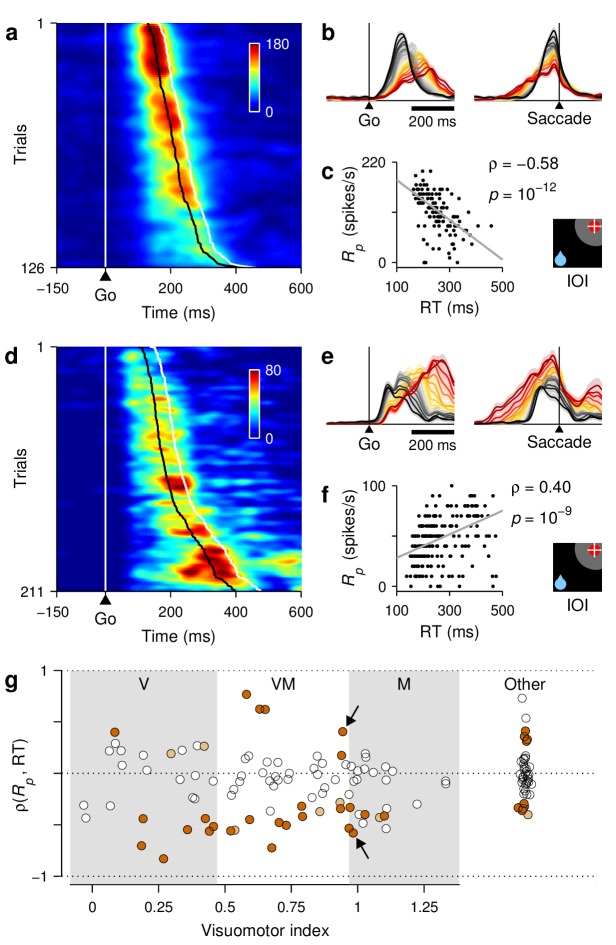
Figure 9. RT sensitivity of individual FEF neurons.
(a–c) Responses of a single FEF cell that fired preferentially during short RTs. All data are from IOI trials (icon). (a) Activity map. Each row corresponds to one trial, and shows the cell's firing rate (represented by color) as a function of time (x axis) with spikes aligned to the go signal (vertical white line). Trials are ordered by RT from fastest (top) to slowest (bottom). For this cell, the time of peak activity (black marks) closely tracks saccade onset (white marks). (b) Firing rate as a function of time, with trials sorted and color-coded by RT, as in Figure 7. (c) Peak response as a function of RT. Each dot corresponds to one trial. The gray line shows linear fit. Numbers indicate Spearman correlation and significance. (d–f) As (a–c) but for a single cell that fired preferentially during long RTs. (g) Spearman correlation between peak response and RT for all classified cells (). For standard cell types (, , ), values on the abscissa correspond to visuomotor index; for other cells, they are arbitrary. Shades demarcate ranges approximately corresponding to standard , , and categories. All correlation values are from IOI trials. Brown points indicate significant neurons (light, 0.05; dark ). Arrows identify example cells in panels above.

