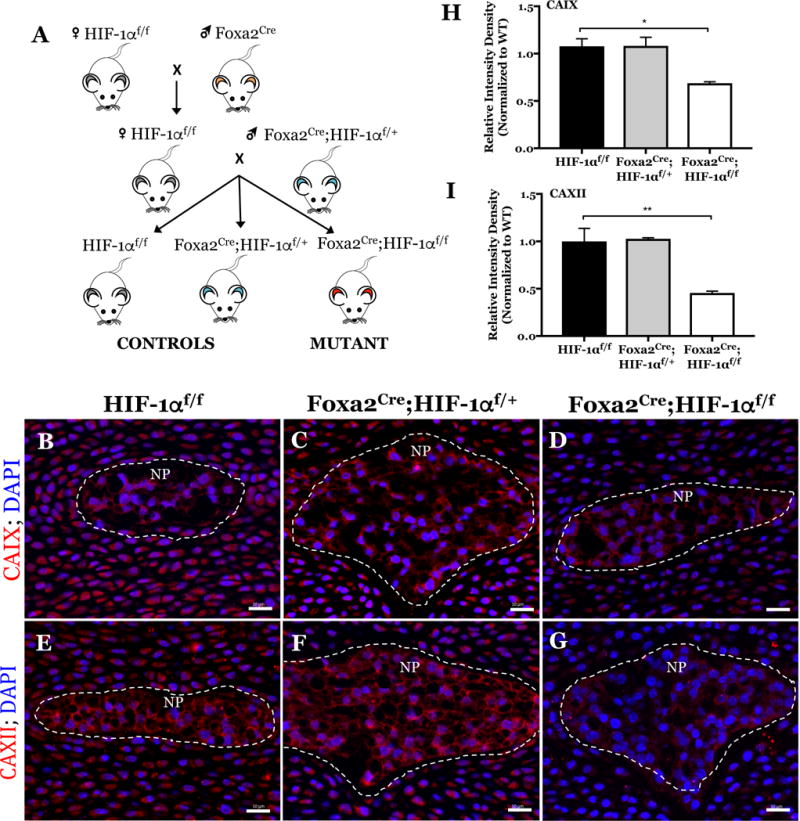
Figure 4. Mice with NP-specific deletion of HIF-1α show decreased expression of CAIX and CAXII in NP tissue.

A) Schematic breeding diagram for generation of NP-specific HIF-1α knockout mice (Foxa2Cre;HIF-1αf/f) from heterozygous Foxa2Cre and control HIF-1αf/f mice. B-G) Representative immunofluorescence images of CAIX (B, C, D) and CAXII (E, F, G) expression in E15.5 control (B, E: HIF-1αf/f), heterozygous (C, F: Foxa2Cre; HIF-1αf/+), and HIF-1α mutant (D, G: Foxa2Cre;HIF-1αf/f) littermate mice imaged at 20x magnification. NP compartment denoted by white dashed line. H, I) Quantification of CAIX (H) and CAXII (I) staining intensity density (integrated density per NP tissue area) in control and HIF-1α cKO mice. 3 conditional null and littermate controls were analyzed. Scale bar; 20 μm.
