
Figure 7. Inhibition of CA9 and CA12 in rat NP cells has no effect on glycolytic flux.
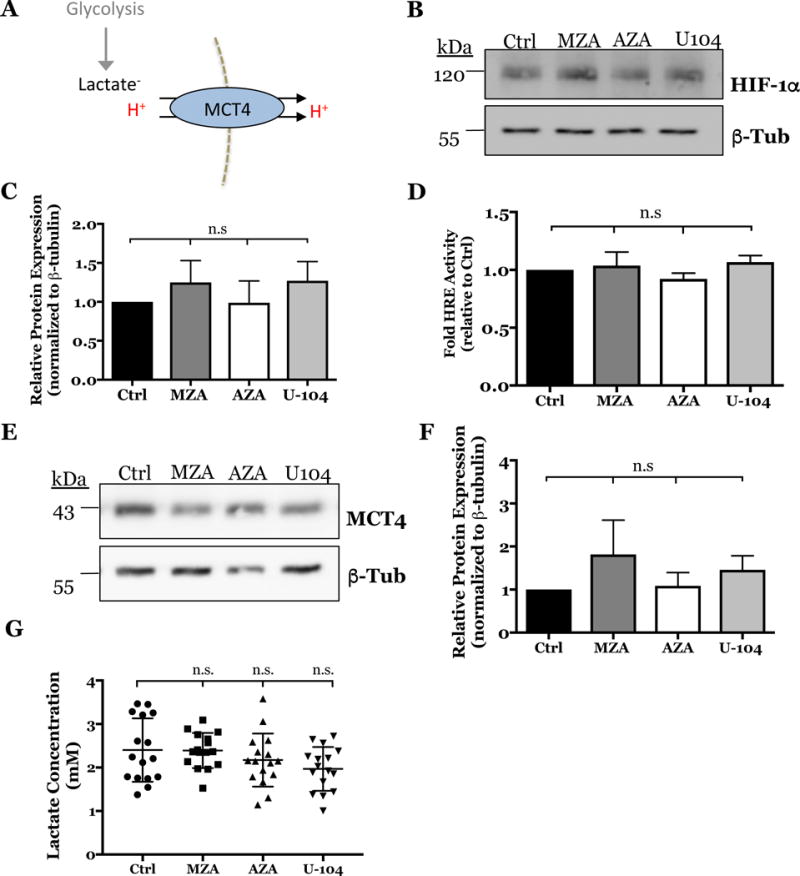
A) Schematic of the glycolytic production of lactate/H+ exported into the extracellular space via MCT4. B) Representative Western blot analysis of HIF-1α after inhibiting CA activity with MZA (500 nM), AZA (500 nM), and U-104 (2 μM) for 18 h in hypoxia. C) Densitometric analysis of Western blot experiment shown in (B) (n=4). D) HRE luciferase reporter activity was unaffected by CA inhibition (n=4, 3 technical replicates each). E) Representative Western blot analysis of MCT4 after inhibiting CA activity with MZA, AZA, and U-104. F) Densitometric analysis of Western blot experiment shown in (E) (n=4). G) Extracellular lactate concentrations were unaffected by CA inhibition with MZA, AZA and U-104 (n=5, 3 technical replicates each). Data is represented as mean ± SE, n≥ 4 independent biological replicates, * p<0.05, ** p<0.01, *** p<0.001.