Fig. 2.

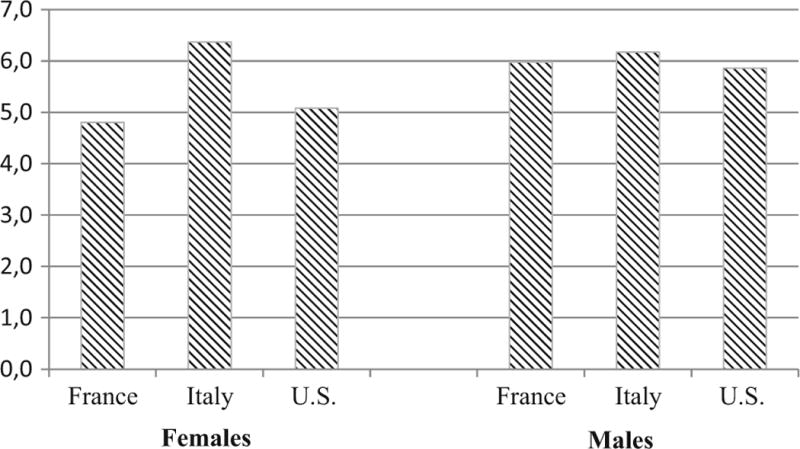
Ratio of the age-standardized “multiple causes” mortality rates to the “underlying cause” mortality rates at ages 50–89 years. France, Italy, and the United States, 2010–2011

Ratio of the age-standardized “multiple causes” mortality rates to the “underlying cause” mortality rates at ages 50–89 years. France, Italy, and the United States, 2010–2011