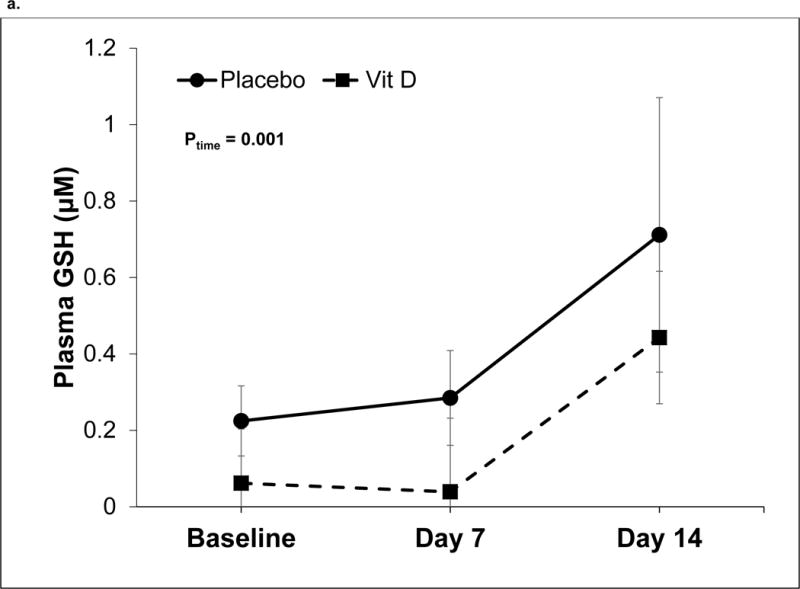
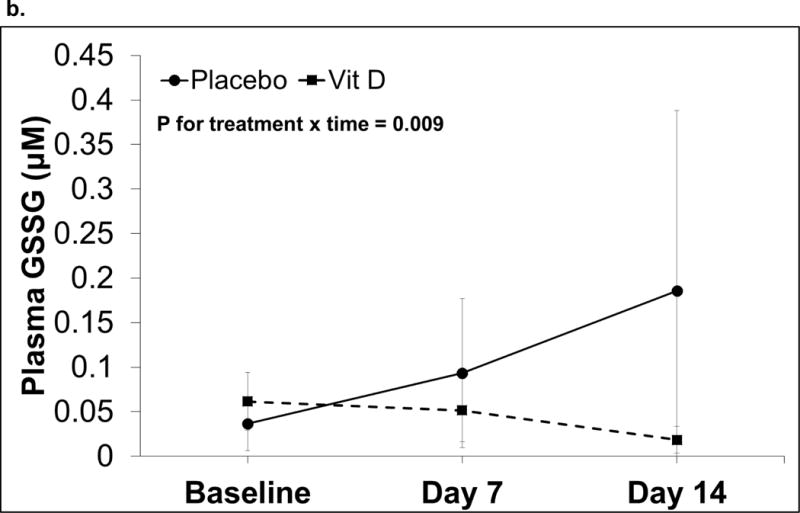
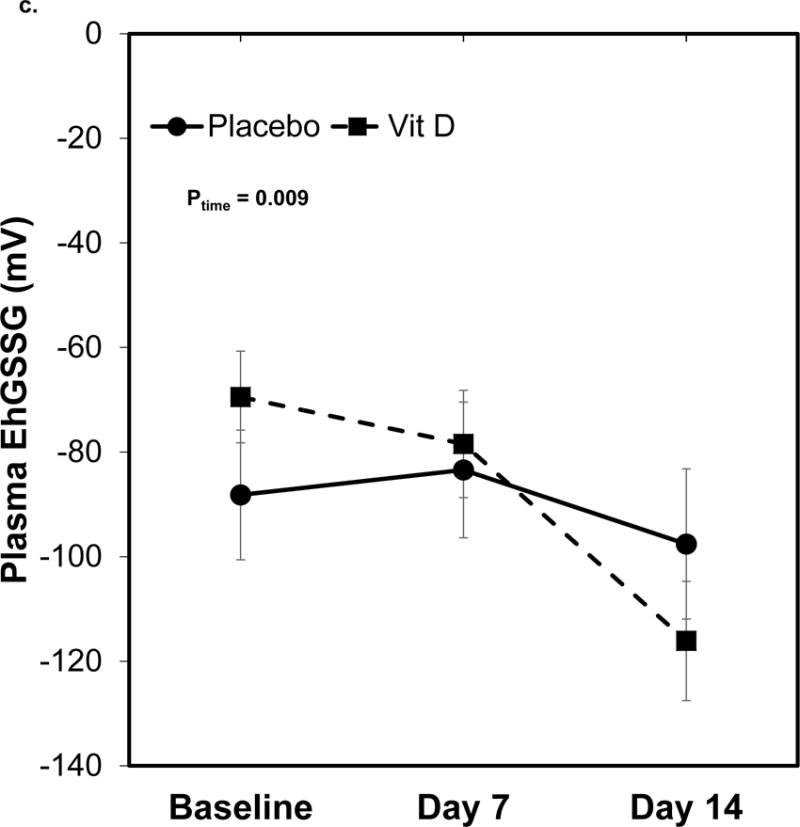
Figure 2. Plasma GSH/GSSG redox outcomes over time in critically ill adults.


Data are shown as least squares (LS) mean ± SEM on back-transformed data. Data were analyzed using linear mixed-effect models with Tukey’s post-hoc analyses. Points not connected by the same letter indicate statistically significant differences. N=20 on day 0 and 7, n=15 on day 14. a) Plasma GSH concentrations. The time effect was statistically significant (P= 0.001). The treatment and treatment-by-time effects were not statistically significant (P = 0.22 and 0.98, respectively). b) Plasma GSSG concentrations. The treatment-by-time effect was statistically significant (P = 0.009). The treatment and time effects were not statistically significant (P = 0.18 and 0.74, respectively). c) Plasma EhGSSG. The time effect was statistically significant (P= 0.009). The treatment and treatment-by-time effects were not statistically significant (P = 0.18 and 0.74, respectively).
