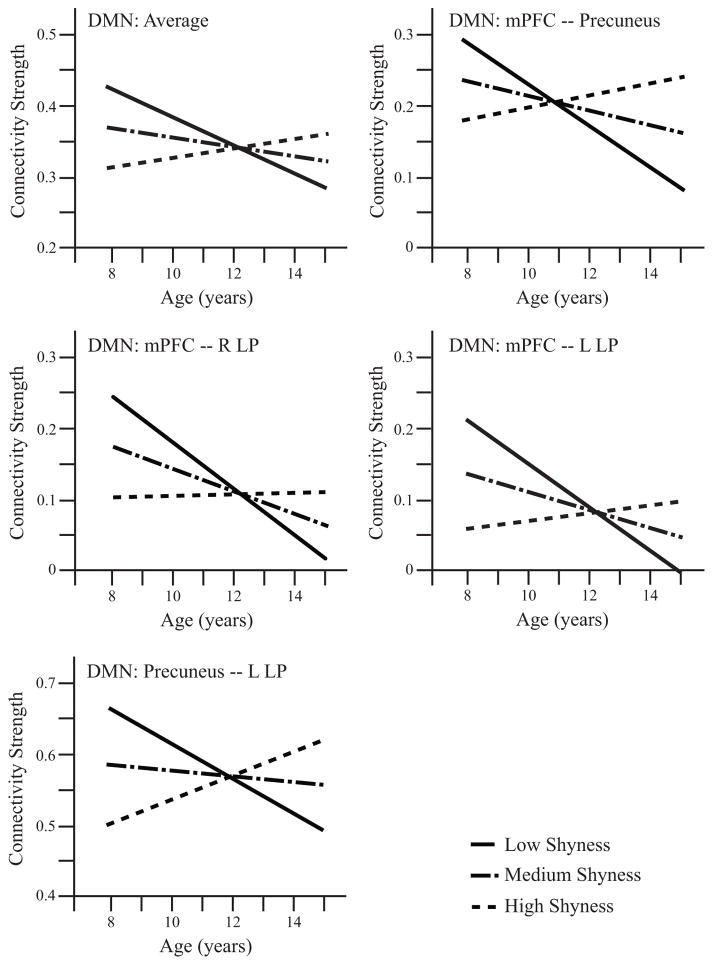
Figure 1.
Functional connectivity trajectories over early adolescence that vary with shyness. Lines represent model fits of the impact of shyness on trajectories of functional connectivity, accounting for covariates described in the main text. Lines representing low shyness are model fits for subjects one standard deviation beneath the sample mean, medium shyness represents subjects at the sample mean, and high shyness represents subjects with shyness one standard deviation above sample mean. The upper left panel indicates average DMN resting state functional connectivity, and the other four panels depict individual connections within the DMN in which trajectories over early adolescence varied with shyness.

