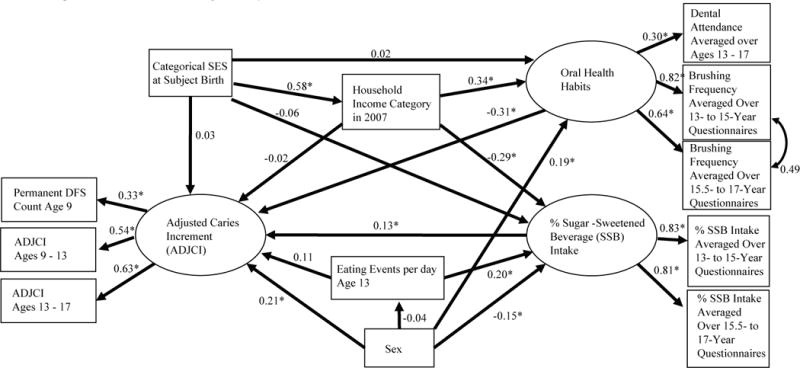
Figure 1.

Path Diagram of Proposed Model for Mechanism of Caries Development among Iowa Fluoride Study Participants. Multiple imputation was used (n=413). Latent variables are represented by circular nodes, while measured (or observed) variables are represented by rectangular nodes. An asterisk (*) indicates path coefficients which are significantly different from zero at the 0.05 level. Note that males were coded as “0” and females were coded as “1”.
