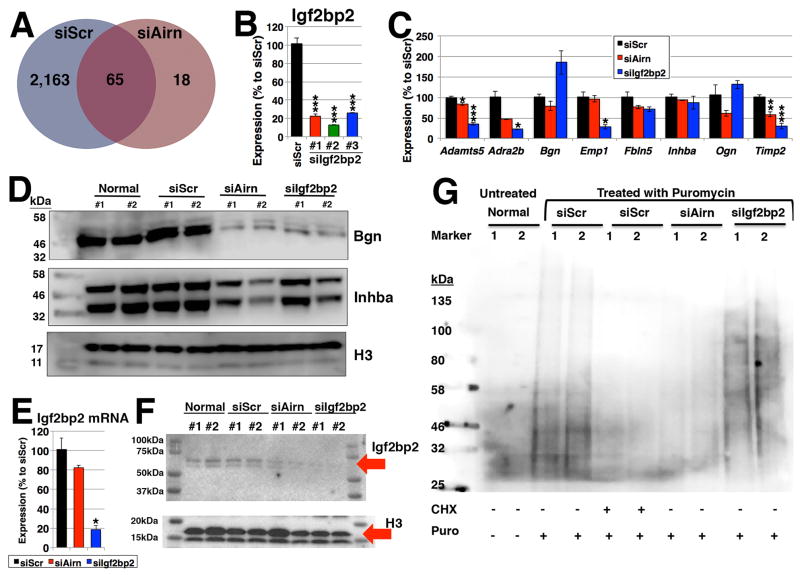
Figure 4. Binding of Igf2bp2.
(A) Venn diagram of Igf2bp2-bound genes upon silencing of Airn. RIP-chip experiments (n=4 samples) were performed using anti-Igf2bp2 antibody and anti-IgG antibody as negative control. The thresholds of 1.5-fold enrichment and FDR<0.05 were applied. (B) Efficiency of Igf2bp2 knockdown. n=3. (C) qRT-PCR. n=3. (D) Western blotting using anti-Bgn and -Inhba antibodies. (E, F) Expression of Igf2bp at the levels of (E) RNA (n=3) and (F) protein (n=2 and representative images from four independent assays). (G) SUnSET. The addition of CHX is used as a negative control. Representative image from 3 independent assays. *, ** and *** represent p<0.05, 0.01 and 0.005, respectively. “n.s.” represents “not statistically significant”.

