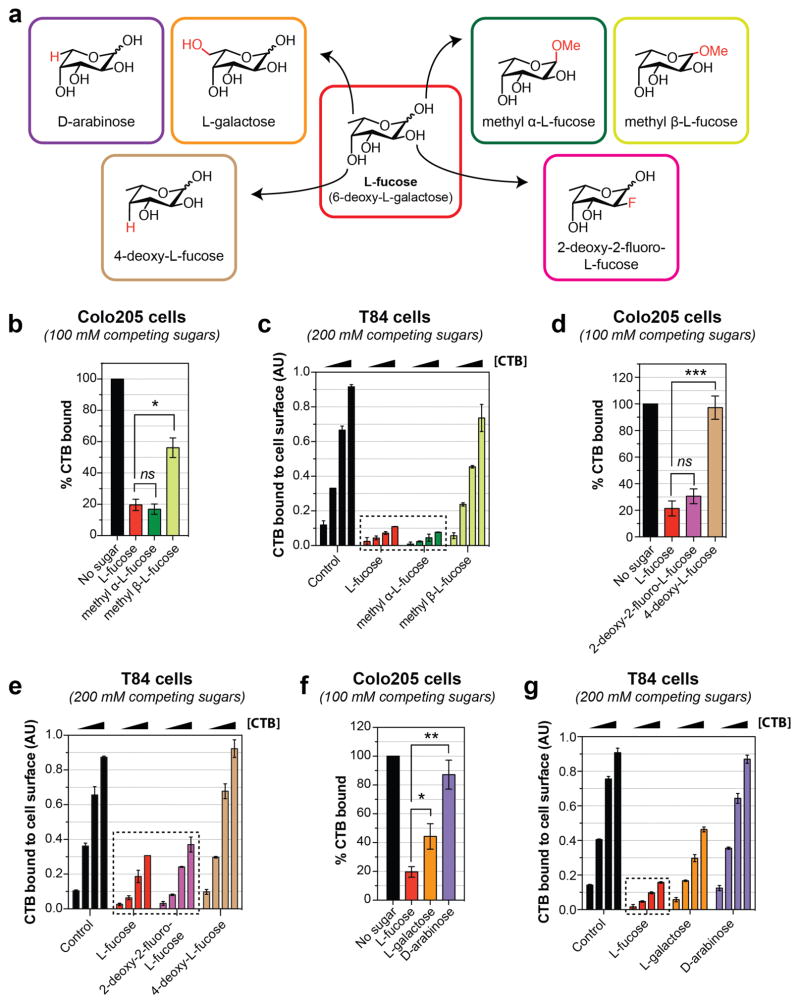
Figure 3. Structure-activity relationship (SAR) analysis of fucose inhibition of CTB binding to cell surfaces.
(a) Positional analogs of L-fucose used in this study. (b, d, and f) Inhibition of CTB binding to Colo205 cells in a flow cytometry assay. Monosaccharides vary from L-fucose at positions 1 (b), positions 2 and 4 (d), and positions 5 and 6 (f). Error bars represent the standard deviation from the mean (n = 3). Histograms for a single representative trial are presented in Figure S3. Statistical significance determined by unpaired Welch’s test: *** indicates a p value < 0.001, ** indicates a p value < 0.01, and * indicates a p value < 0.05. ns indicates difference not statistically significant. (c, e, and g) Inhibition of CTB binding to T84 cells as measured by ELISA. Monosaccharides vary from L-fucose at positions 1 (c), positions 2 and 4 (e), and positions 5 and 6 (g). Error bars represent the standard deviation from the mean (n = 2).

