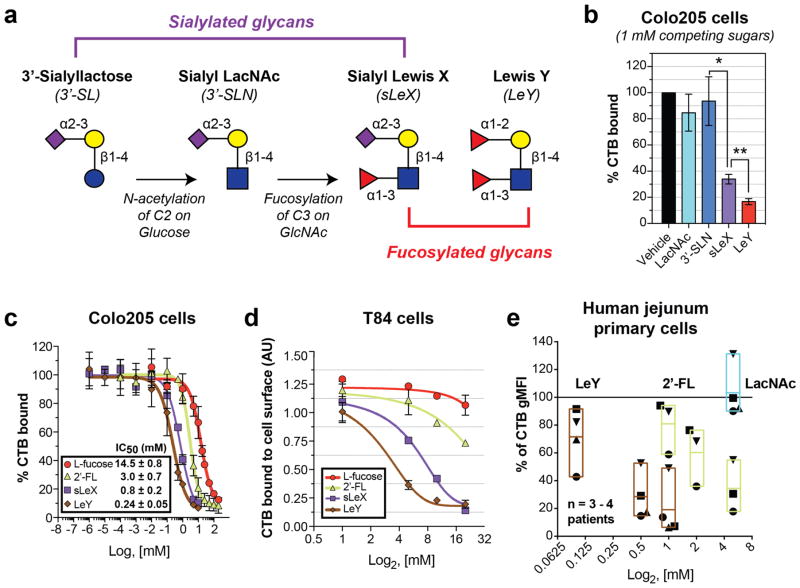
Figure 6. Comparison of the inhibitory potential of sialylated and fucosylated ligands for CTB.
(a) Conversion of an inactive ligand (3′-SL) into a CTB inhibitor (sLeX). (b) Inhibition of CTB binding to Colo205 cells in a flow cytometry assay. Error bars represent the standard deviation from the mean (n = 3). Histograms for a single representative trial are presented in Figure S15. Statistical significance determined by unpaired Welch’s test: ** indicates a p value < 0.01, and * indicates a p value < 0.05. (c) Dose-dependent inhibition of CTB binding to Colo205 cells in a flow cytometry assay. Error bars represent the standard deviation from the mean (n = 3). IC50 values were calculated for individual replicates using GraphPad Prism software and then averaged. (d) Dose-dependent inhibition of CTB binding to T84 cells measured by ELISA. Error bars represent the standard deviation from the mean (n = 2). (e) Inhibition of CTB binding to freshly isolated human jejunal epithelial cells (EpCAM+, CD45 negative) in a flow cytometry assay. Data points indicate % of unblocked CTB gMFI, with unique symbols indicating single patients (n = 3 – 4 patients). Box plots encompassing low-high data points indicate the mean value with an internal line. Flow cytometry histograms for cells from a single representative patient are presented in Figure S17.

