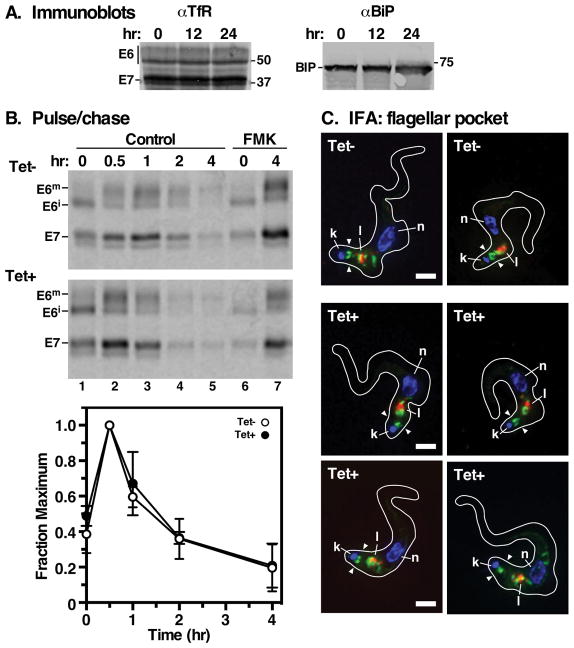
Figure 3. Rab11 depletion does not affect the turnover of transferrin receptor.
A. TbRab11 silencing was induced for the indicated times and TfR levels were assessed by immunoblotting with anti-TfR (107 cell equivalents per lane), and with anti-BiP as a loading control. A representative LICOR image is presented. Mobilities of ESAG6 (E6), ESAG7 (E7) subunits, and BiP are indicated on the left; mobilities of molecular mass markers are indicated on the right (kDa). B. Control and TbRab11 silenced cells were used subjected to pulse/chase (15 min/4 hr) metabolic radiolabeling with [35S]Met/Cys. As indicated FMK024 (20 μM) was included to block lysosomal thiol proteases. At the indicted times cell extracts were prepared and functional transferrin receptor was pulled down using transferrin beads. Immunoprecipitates were analyzed by SDS-PAGE/phosphorimaging. Top. Representative phosphorimages for control (Tet−) and silenced (Tet+) cells are presented (107 cell equivalents per lane). ESAG7, E7; immature ESAG6 (E6i); mature ESAG6 (E6m). Bottom. ESAG7 signals were quantified and normalized to values at 0.5 hours (mean ± std. dev., n=4 biological replicates). C. TfR localization was determined in fixed permeabilized control and silenced cells by immunofluorescence with anti-TfR antibody (green). The lysosome (l) was visualized with mAb anti-p67 (red); nuclei and kinetoplasts (n, k) with DAPI. Representative deconvolved summed stack images are presented. The position of the flagellar pocket is indicated by opposing arrowheads. Scale bar: 2 μm.

