
Figure 5. OCT-1 knock down impairs metformin-induced RUNX2 expression and mineralized nodule formation in UC-MSC-4 cells.
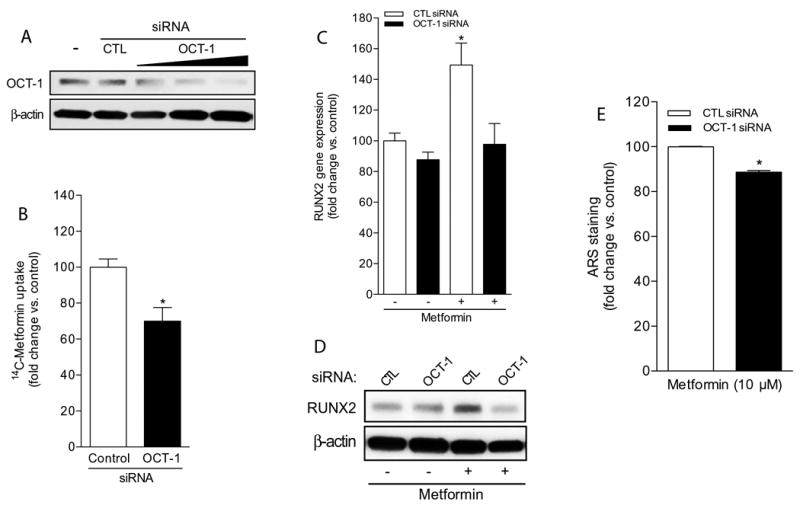
(A) Western blotting to determine OCT-1 expression levels in UC-MSC-4 untransfected cells (-), and in cells transfected with either 25 nM control siRNA (CTL) or with OCT-1 siRNA (5-25 nM). β-actin served as loading control. (B) Metformin uptake assay to analyze OCT-1-dependence in UC-MSC-4 cells transfected with either 25 nM control or OCT-1 siRNA. Data represent mean ± S.E.M. *p<0.05, when compared to control siRNA-transfected cells. (C) Runx2 gene expression analysis by qPCR in UC-MSC-4 cells transfected with either 25 nM control siRNA (CTL siRNA) or OCT-1 siRNA, and then left untreated or exposed to metformin (10 μM) for 7 days. Data represent mean ± S.E.M. *p<0.05, when comparing metformin-treated, CTL siRNA-transfected cells versus other treatment groups. (D) Whole cell extracts from UC-MSC-4 cells transfected with either 25 nM control siRNA (CTL) or OCT-1 siRNA, and then left untreated or treated with metformin (10 μM) for 7 days were subjected to RUNX2 immunoblotting. β-actin served as loading control. (E) Quantification of ARS-stained, calcium-rich mineralized nodules in UC-MSC-4 cells transfected with either 25 nM control siRNA (CTL siRNA) or OCT-1 siRNA following treatment with 10 μM metformin for 21 days. Data represent mean ± S.E.M. *p<0.05, when comparing OCT-1 siRNA-transfected cells versus CTL siRNA-transfected cells.