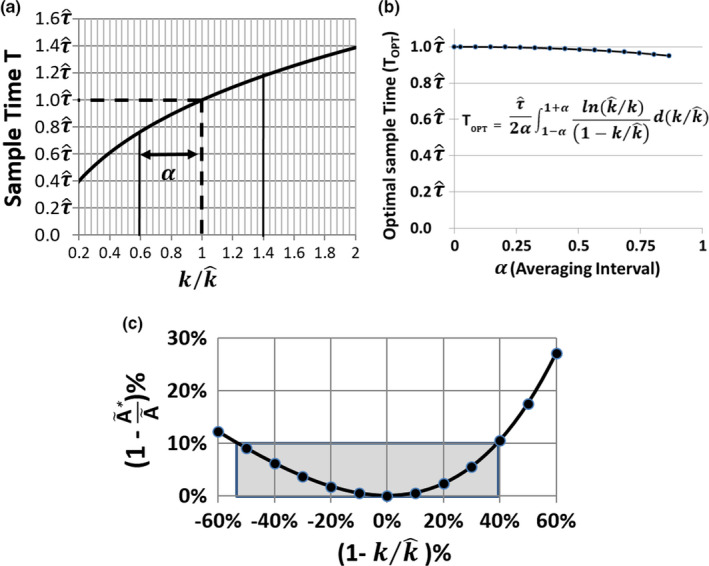
Figure 1.

Monoexponential support data. (a) Plot of the sampling time T for accurately determining when k varies from . (b) Plot of the optimal sampling time T OPT as a function of the averaging interval. T OPT is determined by integrating Eq. (5) over the interval 1 − α to 1 + α. The plot indicates that over a relatively large range, T OPT ≈ . (c) Plot of the error in the estimated total integrated activity as a function of the error in the estimated rate constant. Large variations in k from have a relatively small effect on the accuracy of over a wide range. [Color figure can be viewed at wileyonlinelibrary.com]
