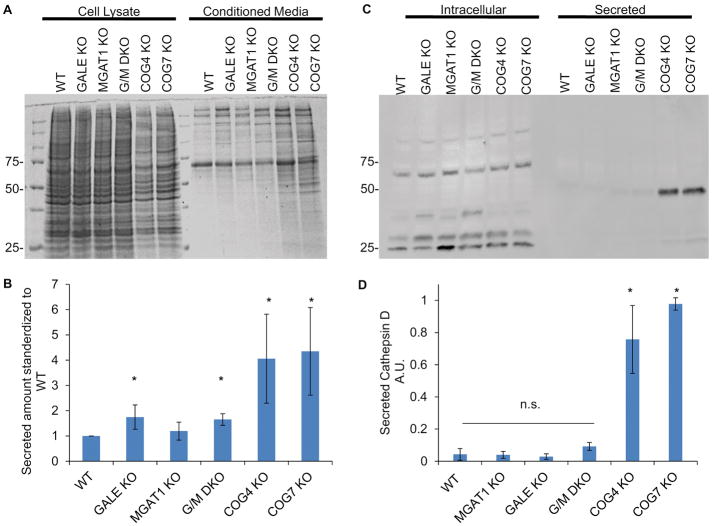
Figure 11. Protein secretion and sorting of Cathepsin D in MGAT1/GALE DKO cells does not phenocopy COG defects.
MGAT1/GALE DKO cells were placed in serum free media for 36 hours alongside with MGAT1, GALE, and COG KOs. Media was then collected and concentrated 10× and cells were collected and lysed. 10μl each of media (A) and cell lysates (A) were analyzed for protein abundance via Coomassie Blue stain (A) and for cathepsin D by WB (C). (B)Total protein amount secreted was quantified and standardized to WT (n=4, n=2 for G/M DKO). (D) Total Cathepsin D secreted was quantified and standardized to intracellular protein abundance and then to the highest secretor (A.U.). * denoted significant change from WT, p< 0.05. Error bars represent standard deviation.

