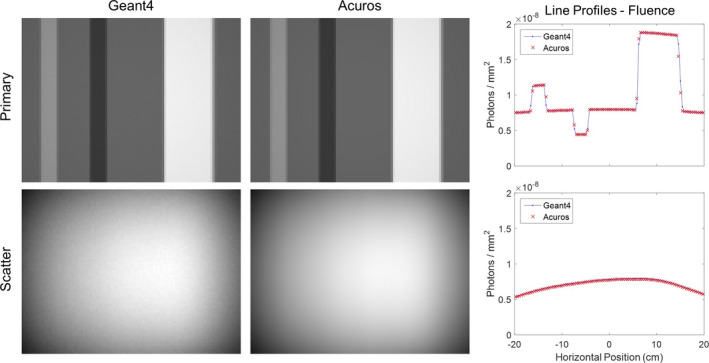
Figure 6.

WLAB phantom primary and scatter images of fluence at the detector, comparing Geant4 and Acuros. Primary images shown on [0, 2 × 10⁻⁸] photons/mm2, scatter images shown on [4 × 10⁻⁹, 8 × 10⁻⁹] photons/mm2 window. Horizontal line profiles are taken across the central row. [Color figure can be viewed at wileyonlinelibrary.com]
